Market Snapshot
Middle bar: base-year value × (1 + CAGR), rounded to two decimals. This is a calculated illustration, not a separately researched annual estimate.
The global electric ice resurfacer market size is estimated at USD 70.98 million in 2025 and is projected to reach USD 108.87 million by 2030, growing at a CAGR of 8.93% over 2026 – 2030. Annual sales of new battery-electric resurfacers rise from about 500 machines to 754, and electric models rise from 53.2% of all new resurfacer sales to 72.9%. New machines account for 90.03% of 2025 value and replacement traction batteries and electric conversions of existing machines for the rest.
Electric machines now outsell fuel-powered ones. Marqstats estimates that about 940 new ice resurfacers of all power types were sold worldwide in 2025 for roughly 9,500 indoor ice sheets and a smaller number of refrigerated outdoor rinks. About 500 of them were battery-electric, up from about 328 in 2021, as municipal arena owners in Canada and Europe replaced propane and natural gas machines that need regular indoor air testing.
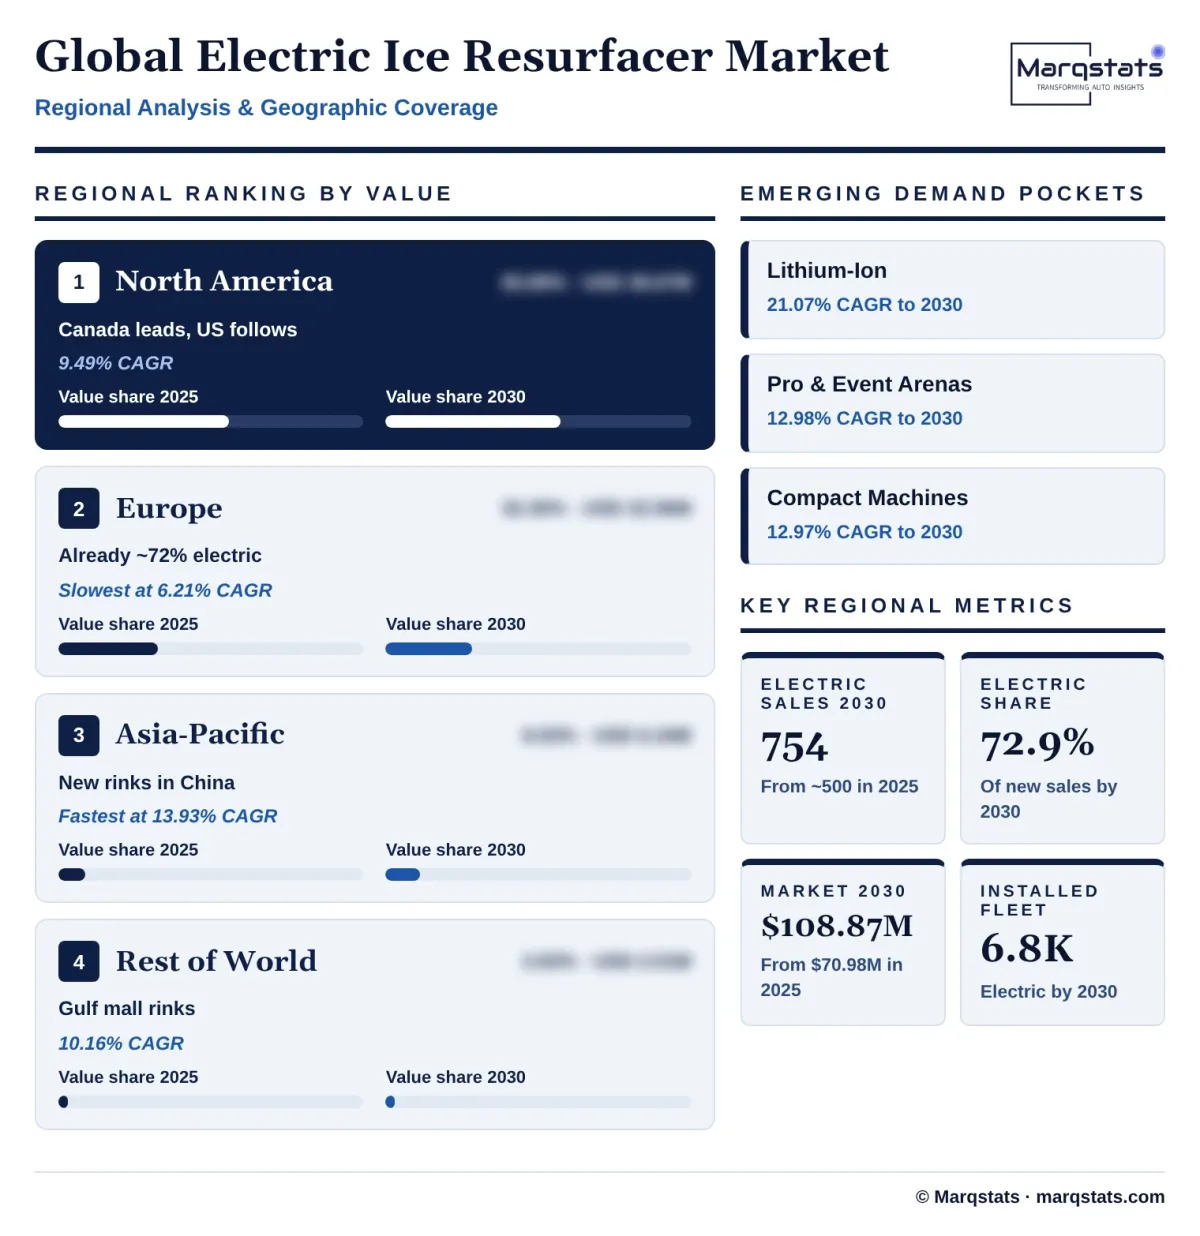
North America is the largest region, with an estimated 55.89% of 2025 value, followed by Europe at 32.35%, Asia-Pacific at 8.93% and the Rest of the World at 2.83%. The study segments the market by value layer, battery chemistry, machine class and end user. Values are in US dollars at constant 2025 average exchange rates, USD 1 = CAD 1.3978 and EUR 1 = USD 1.129, and cover ex-factory machine prices excluding sales taxes plus replacement batteries and conversions.
Key Takeaways
Market Overview & Analysis
Report Summary
Marqstats sizes the global electric ice resurfacer market as the ex-factory value of new self-propelled battery-electric ice resurfacing machines, plus replacement traction battery packs for electric machines and electric conversions of fuel-powered machines. Machines powered by propane, natural gas, gasoline or diesel, ice edgers, tractor-pulled conditioners, hand flood carts, synthetic ice panels and arena refrigeration systems are excluded.
The market grew from an estimated USD 44.19 million in 2021 to USD 70.98 million in 2025, a 12.58% annual rate, as new electric sales rose from about 328 to 500 machines. Growth came from municipal arena owners in Canada and Europe, who replaced propane and natural gas machines when they reached the end of their lives, and from manufacturers that made electric drive standard or offered lithium batteries on their main full-size models.
An ice resurfacer shaves, washes and floods the ice between sessions and is used many times a day. A full-size machine for an NHL-size sheet, such as the Zamboni 552AC, the Olympia Millennium E or the engo Ice Wolf, carries a 77-inch blade, a snow tank of about 3.5 cubic metres and a water tank of about 740 litres. Arena owners keep machines for ten to twenty years, so annual sales are small relative to the installed base and depend on municipal replacement budgets.
The case for electric machines rests on indoor air quality and running cost. Fuel-powered machines emit carbon monoxide and nitrogen dioxide inside closed arenas, and Minnesota's indoor ice arena rules set one-hour limits of 20 ppm for carbon monoxide and 0.3 ppm for nitrogen dioxide and require air testing at least twice a week where combustion resurfacers are used. Electric machines remove the source of these emissions and Resurfice says the Millennium E costs about one tenth as much to operate as a fossil-fuelled model.
The forecast rests on three conditions. Municipal capital budgets in Canada, the United States and Europe continue to fund resurfacer replacement on normal cycles, lithium battery prices continue to fall, and US arena owners increasingly choose electric machines when they replace propane units. Under these conditions, electric sales reach about 754 machines in 2030 and market value reaches USD 108.87 million.
Global Electric Ice Resurfacer Market Size and Forecast
The global electric ice resurfacer market grows from USD 70.98 million in 2025 to USD 108.87 million in 2030, a CAGR of 8.93%. New machines rise from USD 63.90 million to USD 97.89 million, an 8.90% CAGR, and replacement batteries and conversions rise from USD 7.08 million to USD 10.98 million, a 9.17% CAGR. The market reaches an estimated USD 77.39 million in 2026 and passes USD 100 million in 2029.
Unit sales drive growth more than price. New electric machine sales grow from about 500 in 2025 to 754 in 2030, an 8.56% annual rate, while all new resurfacer sales grow only from about 940 to 1,035, about 2% a year, in line with the replacement cycle. Almost all of the growth therefore comes from electric machines taking share from propane and natural gas models.
Prices are stable in real terms. Marqstats estimates blended ex-factory prices of about USD 135,000 in North America, USD 125,000 in Europe, USD 105,000 in Asia-Pacific and USD 115,000 elsewhere in 2025. Municipal quotes show the range: Rapid City in South Dakota paid USD 171,712 for a 2025 Zamboni 552AC after a USD 25,000 trade-in and a Sourcewell discount, and Mapleton Township in Ontario approved an Olympia Millennium E at just over CAD 174,000 in June 2025.
Growth paused in 2025. The market rose 38.19% in 2024 to an estimated USD 76.39 million, lifted by Toronto's purchase of more than 100 electric Zambonis, then fell 7.08% in 2025 as orders returned to normal levels. Growth of about 9% a year resumes from 2026 as the electric share of new sales keeps rising.
The installed electric fleet grows faster than annual sales. Marqstats estimates that about 4,250 electric resurfacers were in service at the end of 2025, rising to about 6,780 by 2030 after allowing for retirements. That fleet drives demand for replacement battery packs, which rise from about 310 a year in 2025 to 495 by 2030.
Market Dynamics
Key Drivers
Five forces are moving arena operators from propane and natural gas machines to battery-electric resurfacers.
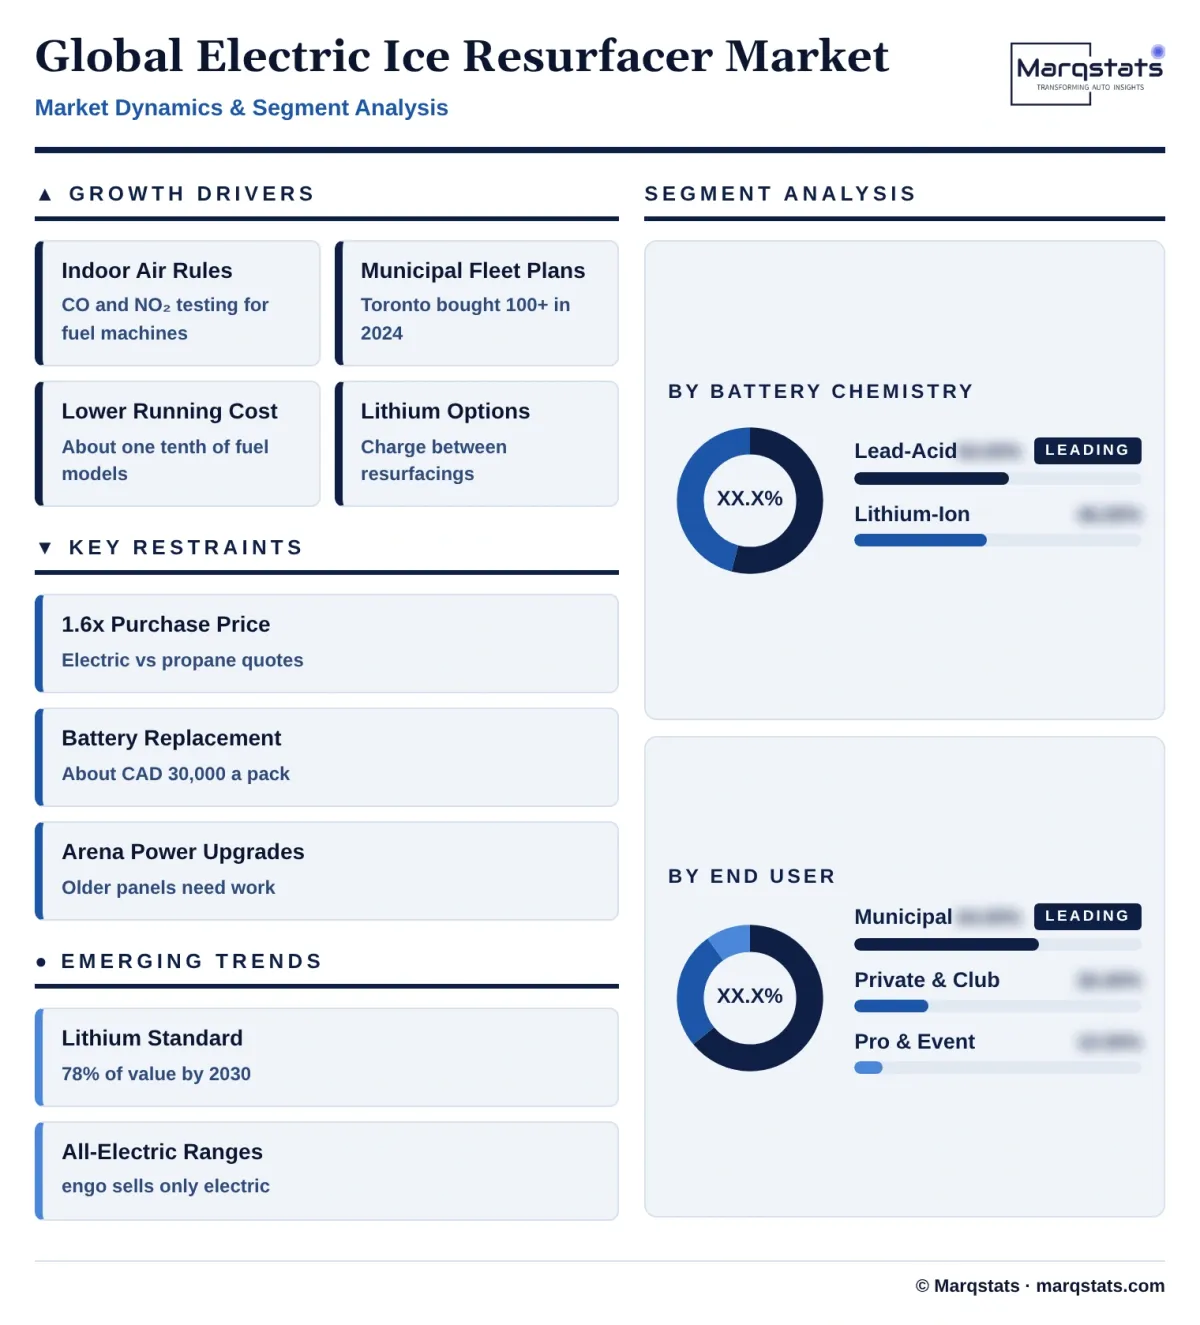
- Indoor air quality rules. Fuel-powered resurfacers and edgers emit carbon monoxide and nitrogen dioxide inside closed arenas. Minnesota requires arenas using combustion resurfacers to test air at least twice a week and to evacuate if carbon monoxide exceeds 83 ppm for more than five minutes or nitrogen dioxide exceeds 2.0 ppm for more than five minutes. Electric machines remove these testing costs and risks, and arena owners cite fume-free operation as the main reason for buying them.
- Municipal climate and fleet plans. Cities in Canada and Europe are electrifying their municipal fleets, and arena machines are an easy early step because they never leave the building. Toronto bought more than 100 electric Zambonis in 2024, Kitchener named its first electric Zamboni in January 2026, and Warwick Township in Ontario added an electric Zamboni and an electric edger in September 2026.
- Lower running and maintenance costs. Resurfice says the Millennium E costs about one tenth as much to operate as a fossil-fuelled machine. Electric machines also avoid engine oil changes, fuel system repairs and exhaust work, which offsets part of the higher purchase price over a ten- to twenty-year life.
- Lithium battery options. Lithium-ion batteries can be charged between resurfacings and weigh far less than lead-acid packs, which makes electric machines practical for busy multi-sheet complexes. Zamboni offers lithium on its 552AC and engo offers a lithium version of its Ice Wolf, Ice Panther, Ice Tiger and Ice Lion models.
- Co-funding and cooperative purchasing. Provincial programmes such as the Northern Ontario Heritage Fund Corporation co-fund arena equipment in smaller towns, utilities such as Bluewater Power sponsor electric machines, and US municipalities buy through cooperative contracts such as Sourcewell. These channels reduce the cost and paperwork of switching to electric.
Key Restraints
Four constraints slow the switch to electric machines, especially in the United States.
- Higher purchase price. Electric resurfacers cost about 1.6 times as much as comparable propane machines. In Clearview Township's 2022 quotes the Olympia Millennium E was 59.2% more expensive than the propane Millennium H, which exceeded the township's CAD 100,000 budget and had to be funded from a reserve.
- Battery replacement costs. Traction batteries last about five to ten years, and Napanee staff estimated a replacement at about CAD 30,000 in 2023. Arena owners that compare purchase prices rather than lifetime costs often choose fuel-powered machines, as Napanee did when it bought a natural gas Olympia Millennium H.
- Electrical upgrades at older arenas. Chargers for electric machines need dedicated power, and older arenas may need panel or service upgrades. Mapleton's June 2025 approval of about CAD 183,000 included electrical upgrades on top of a machine price of just over CAD 174,000.
- Long replacement cycles. Arena owners keep resurfacers for ten to twenty years, and Toronto expects a ten-year life cycle with many units running longer. Slow fleet turnover means the electric share of the installed base rises much more slowly than the electric share of new sales.
Key Trends
Four shifts are changing how electric resurfacers are built, powered and bought.
- Lithium as standard. Lithium-ion rises from 46.00% of market value in 2025 to 78.00% by 2030. Lithium cuts machine weight, removes battery watering and allows opportunity charging between sessions, and manufacturers are moving it from an option to the default on full-size machines.
- All-electric product ranges. engo states that all of its ice resurfacers are fully electric, from the compact IceDingo to the IceLion, and Resurfice sells three electric models, the Millennium E, Mini E and IceBear. As European makers drop fuel models, buyers have fewer reasons to choose combustion.
- Automation and connectivity. WM ice technics developed the WM Mammoth Autopilot, which follows a programmed route to resurface the ice without a driver, and its WM Autopilot assistance system. Fleet telematics and battery monitoring apps help arena managers plan charging and maintenance.
- Reuse of event machines. Machines built for major events move into community rinks afterwards. Telford in the UK announced in March 2026 that it would receive a fully electric Zamboni used at the Winter Games in Italy, giving a smaller venue a premium machine at lower cost.
Strategic Implications
- For manufacturers, lithium and lower weight are the main levers. Lithium packs cut weight by about a quarter on full-size machines and allow charging between sessions. Making lithium standard and offering battery health monitoring will help win busy multi-sheet complexes and US arenas still using propane.
- For arena owners, lifetime cost decides the choice. Electric machines cost about 1.6 times propane at purchase but avoid fuel, engine maintenance and air testing. Owners should budget for a battery replacement during the life of the machine and check electrical capacity before ordering.
- For distributors and service firms, the installed fleet is a growing base. About 4,250 electric machines were in service at the end of 2025, rising to about 6,780 by 2030. Replacement batteries, conversions and service contracts like Toronto's five-year agreement offer recurring revenue.
- For governments and utilities, small grants move decisions. Co-funding from NOHFC and sponsorship from utilities such as Bluewater Power help smaller towns cover the electric premium. Clear indoor air rules, like Minnesota's testing requirements, make the case for electric machines without direct subsidy.
- For investors, the market is small, concentrated and steady. Four specialist makers supply most machines, demand depends on municipal budgets rather than economic cycles, and electric share gains add growth of about 9% a year on top of a flat replacement market.
Market Segmentation
New self-propelled battery-electric resurfacers account for USD 63.90 million in 2025, 90.03% of value, from about 500 machines at a blended ex-factory price of about USD 127,800. Machine sales rise to USD 97.89 million by 2030, an 8.90% CAGR, as unit sales reach 754. Full-size machines for NHL- and Olympic-size sheets make up most of the value.
Replacement traction battery packs for electric machines and conversions of fuel-powered machines to electric drive account for USD 7.08 million in 2025, 9.97% of value. This layer grows at 9.17% a year to USD 10.98 million by 2030 as the installed electric fleet grows from about 4,250 to 6,780 machines and lead-acid packs are replaced with lithium.
Lithium-ion machines and packs account for USD 32.65 million in 2025, 46.00% of value, and grow fastest, at 21.07% a year, to USD 84.92 million and 78.00% of value by 2030. Lithium packs weigh much less than lead-acid, need no watering and can be charged between resurfacings, which suits busy multi-sheet arenas.
Lead-acid machines and packs account for USD 38.33 million in 2025, 54.00% of value, but decline at 8.98% a year to USD 23.95 million and 22.00% of value by 2030. Lead-acid remains the standard battery on several models and is still chosen for its lower price, but it adds weight and needs more maintenance.
Full-size machines with blades of about 77 inches, built for NHL- and Olympic-size sheets, account for USD 60.33 million in 2025, 85.00% of value, rising to USD 89.27 million by 2030, an 8.15% CAGR. The Zamboni 552AC, Olympia Millennium E and engo Ice Wolf are typical models.
Smaller machines for studio rinks, training sheets and seasonal or mall rinks account for USD 10.65 million in 2025, 15.00% of value. They grow faster, at 12.97% a year, to USD 19.60 million and 18.00% of value by 2030, as new small rinks open in Asia and Europe and smaller venues replace propane units. Examples include the Olympia Mini E and engo IceDingo and IceFox.
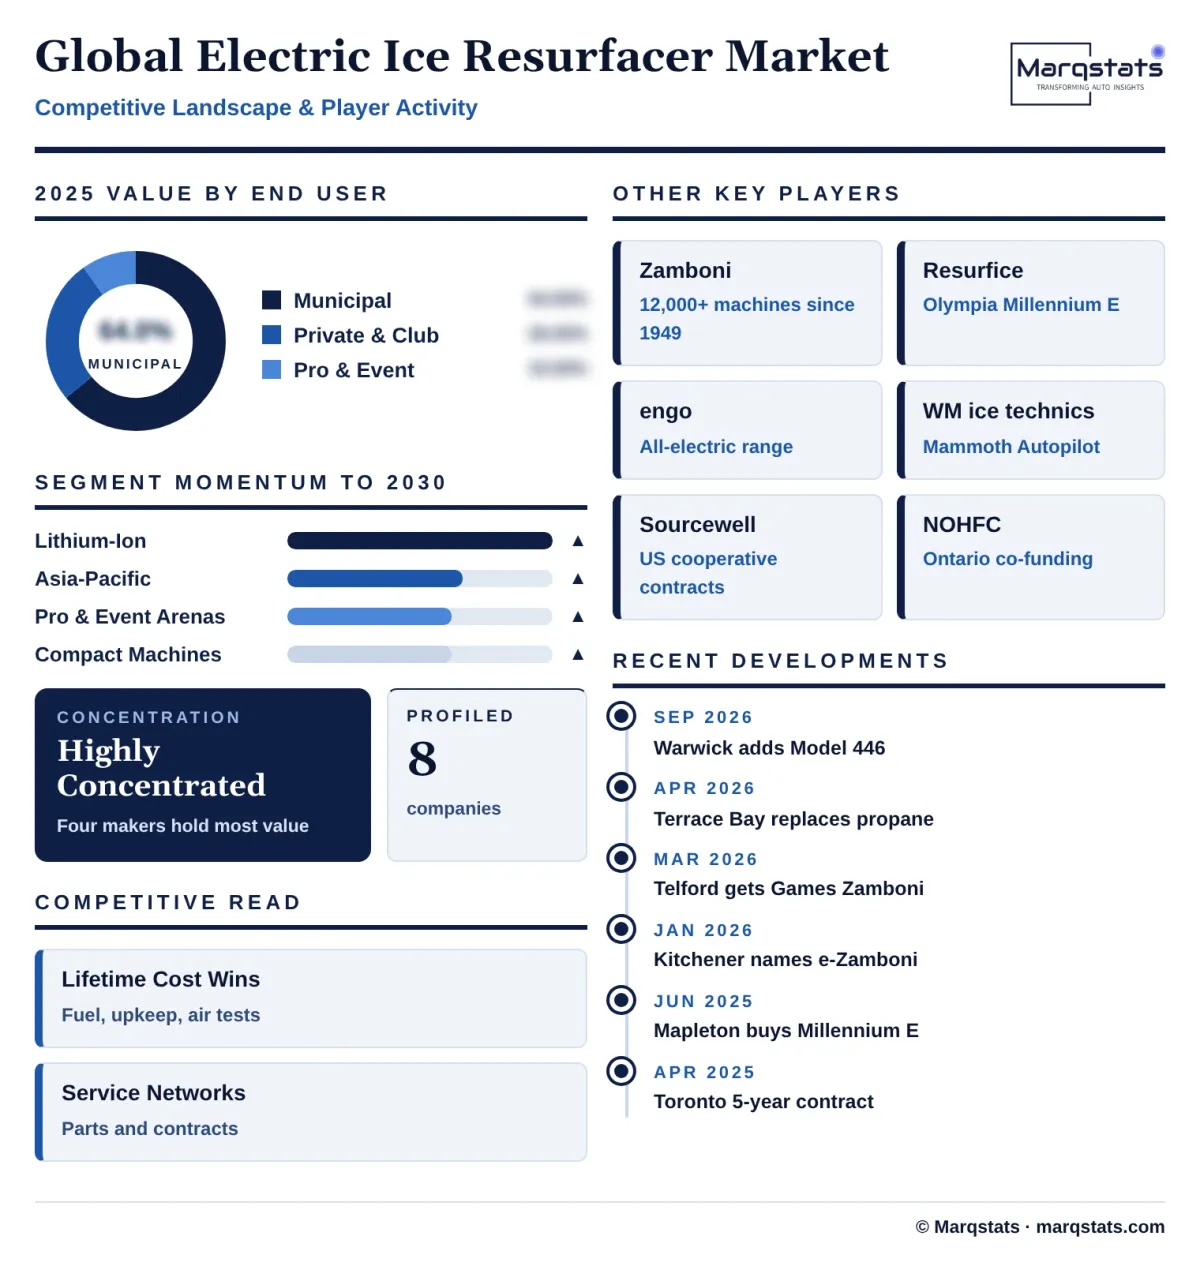
Arenas owned by cities, towns and townships account for USD 45.43 million in 2025, 64.00% of value, rising to USD 65.32 million by 2030, a 7.53% CAGR. Municipal owners buy through tenders and cooperative contracts and often lead the switch to electric under fleet climate plans, as in Toronto, Kitchener and Ontario townships.
Privately owned rinks, clubs, schools and universities account for USD 18.45 million in 2025, 26.00% of value, rising to USD 30.48 million by 2030, a 10.56% CAGR. These owners are more price-sensitive but adopt electric machines as prices for compact models fall and air testing costs rise.
Professional sports venues, training centres and major event venues account for USD 7.10 million in 2025, 10.00% of value, and grow fastest by end user, at 12.98% a year, to USD 13.07 million by 2030. They buy premium lithium machines with automation and ice-levelling options, and event machines are later resold to community rinks.
By Geography
North America
North America is the largest region, with an estimated USD 39.67 million in 2025, 55.89% of value, rising to USD 62.41 million by 2030, a 9.49% CAGR and 57.33% of value. Canada has the densest rink network; Statistics Canada counted 2,183 arenas with at least one indoor rink in its 2014 survey, and Marqstats estimates about 70% of new Canadian resurfacers sold in 2025 were electric, led by Ontario municipalities such as Toronto, Kitchener, Mapleton, Terrace Bay and Warwick. The United States has more private rinks and a lower electric share, about 32% of 2025 sales, but cities such as Rapid City are buying electric Zambonis through Sourcewell, and US adoption drives most of the region's growth. Zamboni builds machines in Paramount, California, and Brantford, Ontario, and Resurfice builds Olympia machines in Elmira, Ontario.
Europe
Europe accounts for an estimated USD 22.96 million in 2025, 32.35% of value, rising to USD 31.03 million by 2030, a 6.21% CAGR. It has the highest electric share of new sales, about 72% in 2025, because engo sells only electric resurfacers, WM ice technics and Zamboni's Swedish plant at Österfärnebo serve the Nordic and Alpine markets, and many arena owners have already switched. Growth is slower than in other regions because there are fewer propane machines left to replace. Russia, Sweden, Finland, Germany, Switzerland, Czechia and Italy hold most of the region's indoor sheets.
Asia-Pacific
Asia-Pacific accounts for an estimated USD 6.34 million in 2025, 8.93% of value, and grows fastest, at 13.93% a year, to USD 12.17 million and 11.18% of value by 2030. China built many new rinks around the Beijing 2022 Winter Games and continues to promote winter sports, while Japan and South Korea replace machines at established rinks. Many new rinks in the region are smaller mall and training sheets, which favour compact electric machines.
Rest of the World
The Rest of the World, including the Middle East, Latin America and Africa, accounts for an estimated USD 2.01 million in 2025, 2.83% of value, rising to USD 3.26 million by 2030, a 10.16% CAGR. Demand comes from mall rinks and new arenas in the Gulf states, and from a small number of rinks in Latin America and South Africa, which usually buy compact electric machines from European or North American suppliers.
How Competition Is Evolving
The global electric ice resurfacer market is highly concentrated. Four specialist manufacturers supply most machines: Frank J. Zamboni & Co. in the United States and Canada, Resurfice Corp. with its Olympia brand in Canada, and engo and WM ice technics in South Tyrol, Italy. Marqstats estimates these four account for well over four-fifths of 2025 value.
Zamboni is the best-known brand and has delivered more than 12,000 machines since 1949. It builds machines in Paramount, California, Brantford, Ontario, and Österfärnebo, Sweden, offers both electric and fuel-powered models, and sells to US public buyers through Sourcewell. Its electric range includes the 552AC, with lead-acid as standard and lithium-ion as an option, and the Model 446 chosen by Warwick Township in 2026.
Resurfice competes on price and Canadian dealer reach. Its Olympia electric range covers the full-size Millennium E, the compact Mini E and the low-profile IceBear, and the Millennium E has won several Ontario municipal tenders on price, including Clearview in 2022 and Mapleton in 2025.
engo and WM ice technics lead in Europe. engo states that all of its resurfacers are electric and offers lithium versions on its larger models, selling in North America through distributors such as Engo Equipment Sales and Joe Johnson Equipment. WM ice technics competes with large and compact machines and automation, including the WM Mammoth Autopilot.
Competition is moving from purchase price to lifetime cost. Buyers compare purchase price, battery life, charging time, service support and parts availability. Toronto's five-year parts and service contract and Sourcewell's cooperative contracts show that service networks and procurement channels matter as much as machine specifications.
New entrants face high barriers. Arena owners buy rarely, expect machines to last ten to twenty years and rely on local service, so established brands with dealer networks and parts depots hold a strong advantage. Smaller suppliers mostly compete in compact machines and conversions of existing fuel-powered units.
Companies Covered
Companies covered in the report include:
Recent Market Activity
Table of Contents
Coverage & Segmentation
The study covers the global electric ice resurfacer market across North America, Europe, Asia-Pacific and the Rest of the World, with 2025 as the base year, 2021 – 2025 as the historical period and 2026 – 2030 as the forecast period. Values are in US dollars at constant 2025 average exchange rates of USD 1 = CAD 1.3978 and EUR 1 = USD 1.129. The market is defined as the ex-factory value, excluding sales taxes, of new self-propelled battery-electric ice resurfacers, plus replacement traction battery packs for electric machines and electric conversions of fuel-powered machines. It is segmented by value layer, battery chemistry, machine class and end user.
Propane, natural gas, gasoline and diesel resurfacers, ice edgers, tractor-pulled conditioners, hand flood carts, ice painting systems, synthetic ice panels and arena refrigeration plants are excluded. Unit sales, prices, installed fleet, electric shares and segment and regional splits are Marqstats estimates built on manufacturer specifications, municipal tenders and council reports, cooperative purchasing records and rink counts.