Market Snapshot
Key Takeaways
Market Overview & Analysis
Report Summary
The Chile two-wheeler market covers motorcycles, scooters, and mopeds sold for private, commercial, and institutional use. The study measures demand in unit volumes and revenue across 2021 to 2025 historical years and 2026 to 2030 forecast years, with 2025 as the base year. Coverage spans propulsion type, engine displacement and motor power, price band, end user, sales channel, and brand.
Chile differs from higher-volume Latin American markets. Motorcycle ownership serves commuting and recreation rather than mass mobility, and the country carries a higher share of mid- and high-capacity motorcycles than most regional peers. Household income levels, near-total import dependence, and expanding urban delivery all shape the demand mix. The market is small in units, yet the revenue base is supported by premium models and rising electric adoption.
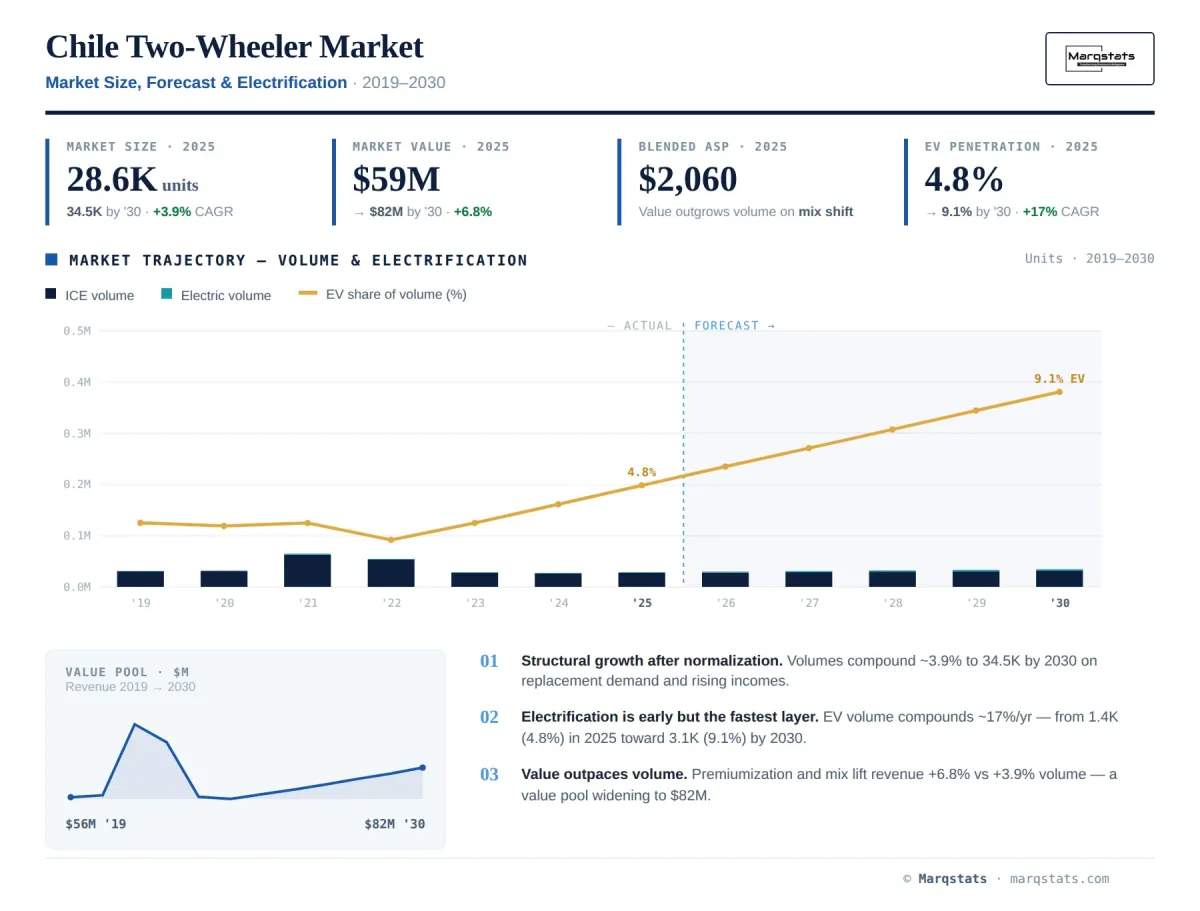
Growth is attributed to steady urban commuting demand, the expansion of food and parcel delivery, and improving affordability of small-displacement models. Electrification adds a second growth axis. A wider charging network, supportive energy-efficiency policy, and delivery operators adopting electric fleets all raise electric volumes. Revenue grows faster than units because buyers move toward higher-priced motorcycles and electric models command higher average selling prices.
Import dependence is a defining feature. Chile assembles almost no two-wheelers, so nearly all supply arrives from Asia and, to a smaller extent, Europe. Landed cost depends on the peso exchange rate, shipping rates, and tariff treatment under trade agreements. Retail prices therefore move with currency cycles, and importers manage inventory around expected exchange-rate shifts. This exposure shapes affordability at the entry tier and influences the timing of demand across the forecast period.
Market Dynamics
Key Drivers
- Urban commuting demand supports steady motorcycle sales across the Metropolitan Region and secondary cities, where congestion and parking costs favor two-wheelers.
- Growth of food and parcel delivery raises demand for durable commuter motorcycles and, increasingly, electric two-wheelers used by couriers.
- Affordability of small-displacement models sustains entry-level volumes, owing to lower purchase prices and low running costs relative to cars.
- Electrification incentives and a threefold expansion of public charging infrastructure between 2021 and 2025 improve conditions for electric two-wheeler adoption.
- Online retail expansion widens access to models and financing, owing to established e-commerce platforms and courier-oriented rental offers.
Key Restraints
- Near-total import dependence exposes prices to exchange-rate movements and freight costs, which raises purchase prices during peso depreciation.
- Limited access to consumer credit constrains first-time buyers, owing to conservative lending on lower-value vehicles.
- Sparse charging and service coverage outside major cities slows electric adoption in regional markets.
- Weather and terrain in southern regions restrict year-round riding, which caps demand outside central Chile.
Key Trends
- Electric two-wheelers gain share, moving from below 5% of units in 2025 toward 9% by 2030 as courier fleets and urban riders switch.
- Online sales channels scale rapidly and are projected to surpass dealership volumes before 2030.
- Premium and high-performance motorcycles grow faster than the entry tier, owing to recreational and touring demand among higher-income riders.
- Chinese and Indian brands expand their footprint at the value end, while Japanese and European marques hold premium positions.
Market Segmentation
Motorcycles are the dominant category, at close to 85% of unit sales in 2025. Volumes reach 24.31 thousand units in 2025 and are projected to reach 29.65 thousand units by 2030, a 4.04% CAGR. Demand spans commuting, delivery, and recreation. Small commuter models drive volume, while mid- and high-capacity motorcycles lift average revenue per unit.
Within motorcycles, commuter models in the 110 to 150 cc range carry the largest volumes, while touring and adventure models drive value growth. Riders in central Chile favor practical commuter machines, and higher-income buyers add demand for larger motorcycles used in recreation. Replacement demand grows as the installed base ages, which supports steady renewal across the forecast period.
Scooters form the second category, at about 12.5% of units in 2025. Volumes rise from 3.57 thousand units in 2025 to 4.39 thousand units by 2030, a 4.72% CAGR. Urban buyers favor scooters for short trips and ease of use. Electric scooters add incremental demand within this category.
Electric scooters are gaining ground within the scooter category, owing to low running costs and suitability for short urban trips. Urban delivery riders add further demand for scooter-format electric models.
Mopeds are a small and declining category. Volumes fall from 0.71 thousand units in 2025 to 0.44 thousand units by 2030, a negative 9.98% CAGR. Buyers migrate toward higher-capacity motorcycles and electric models, which erodes moped demand.
Combustion models held about 95% of units in 2025. Volumes move from 27.24 thousand units in 2025 to 31.32 thousand units by 2030, a 2.88% CAGR. Combustion remains the base of the market through the forecast period, however its share declines as electric models advance.
Combustion models retain advantages in range, refueling speed, and lower upfront price, which sustains their dominance in regional markets with limited charging access. Used and entry-level combustion demand also remains firm, owing to constrained consumer credit.
Electric two-wheelers are the fastest-growing propulsion type. Volumes rise from 1.36 thousand units in 2025 to 3.15 thousand units by 2030, a 17.19% CAGR, and revenue expands at a 19.42% CAGR. Growth is driven by courier fleets, urban commuters, a wider charging network, and supportive energy-efficiency policy. Electric share of units is projected to reach roughly 9% by 2030.
Courier operators are the most active early adopters, owing to high daily mileage that rewards lower energy costs. Rental and fleet programs lower the entry barrier for riders who cannot fund an outright purchase. As battery range and charging access improve, private commuters add to electric demand through the forecast period.
Small-displacement models anchor the market. Combined volumes for engines up to 150 cc account for about 60% of combustion units, with the 111 to 125 cc band the single largest at 8.28 thousand units in 2025. Low prices and low running costs sustain this base.
Mid-capacity motorcycles serve commuting and touring buyers seeking more power. This band grows steadily, owing to rising incomes and recreational demand. Average selling prices exceed the entry tier, which supports revenue growth.
High-capacity motorcycles form a smaller unit share, at 2.49 thousand units in 2025, yet they carry the highest prices. Above 350 cc volumes grow at a 6.18% CAGR, and revenue grows at an 8.20% CAGR, owing to touring and premium demand among higher-income riders.
Demand for large motorcycles concentrates in the capital and northern regions, where incomes support discretionary spending on recreation. Touring and adventure use sustains this band even as unit counts stay modest.
Within electric two-wheelers, the 1.1 to 3.0 kW band is the largest in 2025, while the above 5.0 kW band grows fastest at a 23.85% volume CAGR. Higher-power electric models gain share as performance and range improve.
The entry tier is the largest price band, at close to 59% of units in 2025 with 16.82 thousand units. Volumes grow at a 3.03% CAGR. First-time buyers and commuters sustain this tier.
The mid segment held about 25% of units in 2025 with 7.26 thousand units, growing at a 4.46% CAGR. Buyers trade up from entry models for better performance and features.
Premium models reached 3.67 thousand units in 2025 at a 5.18% CAGR, while high-premium and performance models grow fastest at a 7.39% CAGR. These bands lift average revenue and reflect recreational and touring demand.
Touring, adventure, and performance buyers concentrate in the premium tiers, and their purchases lift average revenue well above the entry base. Brand strength and after-sales support weigh heavily on purchase decisions in these bands.
Private consumers are the dominant end user, at roughly 90% of demand. Purchases serve commuting, personal mobility, and recreation. This base is stable through the forecast period.
Commercial demand grows faster than private demand. Delivery and logistics volumes rise at a 5.89% CAGR, ride-hail, rental, and tourism use expands at an 8.94% CAGR, and business fleet demand grows at a 6.37% CAGR. Courier operators drive much of this growth, and many adopt electric models to lower running costs.
Delivery platforms and rental operators expand the commercial base, and their duty cycles favor durable, low-cost machines. Electrification advances fastest in this end-user group, owing to predictable routes and cost-driven purchasing.
Dealerships and physical retailers held about 78% of units in 2025 with 22.34 thousand units. However, offline volumes decline at a negative 6.88% CAGR as buyers shift online. Physical channels retain value for premium sales, service, and financing.
Online retail is the fastest-growing channel. Volumes rise from 6.25 thousand units in 2025 to 18.56 thousand units by 2030, a 21.60% CAGR, and revenue grows at a 25.57% CAGR. Online sales are projected to overtake offline volumes before 2030, owing to e-commerce platforms, courier-oriented offers, and wider model access.
Online growth reflects both consumer buying habits and courier-oriented sales models. Platforms bundle financing, insurance, and delivery, which lowers friction for first-time buyers. Physical dealers retain a role in premium sales and after-sales service, however their share of unit volume declines steadily through the forecast period.
By Geography
Santiago Metropolitan Region
The Santiago Metropolitan Region is the largest demand center, owing to its concentration of population, employment, and delivery activity. Population data from the national statistics institute (ine.gob.cl) records the country’s largest urban base here. Commuting, courier fleets, and premium recreational demand all concentrate in the capital, which makes it the primary market for new-model launches and electric two-wheelers.
Valparaíso Region
Valparaíso combines coastal cities, a major port, and tourism corridors. Demand spans commuting in Viña del Mar and Valparaíso and recreational riding along the coast. The region supports both entry-level and mid-capacity motorcycle sales.
Seasonal tourism raises rental and recreational demand along the coast during summer months, which lifts scooter and mid-capacity motorcycle sales. Port activity also supports commercial and delivery use in the region.
Northern Mining Regions
Antofagasta, Atacama, and Tarapacá carry higher average incomes, owing to mining employment. These regions support premium and high-capacity motorcycles. The public charging master plan for the northern macrozone also improves conditions for electric adoption in this area.
Long travel distances and a dispersed population shape demand toward durable motorcycles, while higher disposable incomes support premium and electric adoption in urban mining centers.
Biobío and Southern Regions
Biobío and southern regions add demand around secondary cities and agricultural districts. Weather and terrain limit year-round riding, which caps volumes relative to central Chile. Small-displacement and utility-oriented models are most common here.
Utility use in agriculture and small-business delivery sustains entry-level demand, while colder and wetter conditions limit recreational riding across much of the year.
How Competition Is Evolving
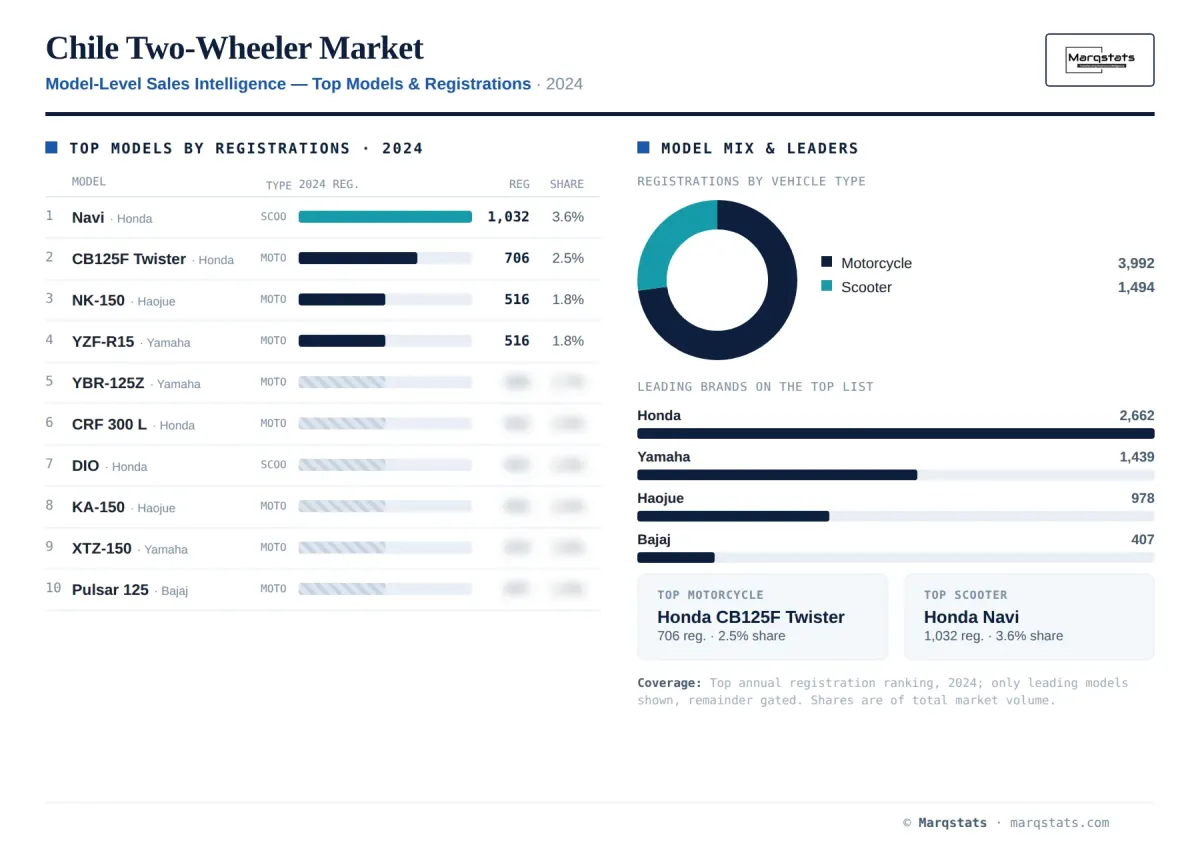
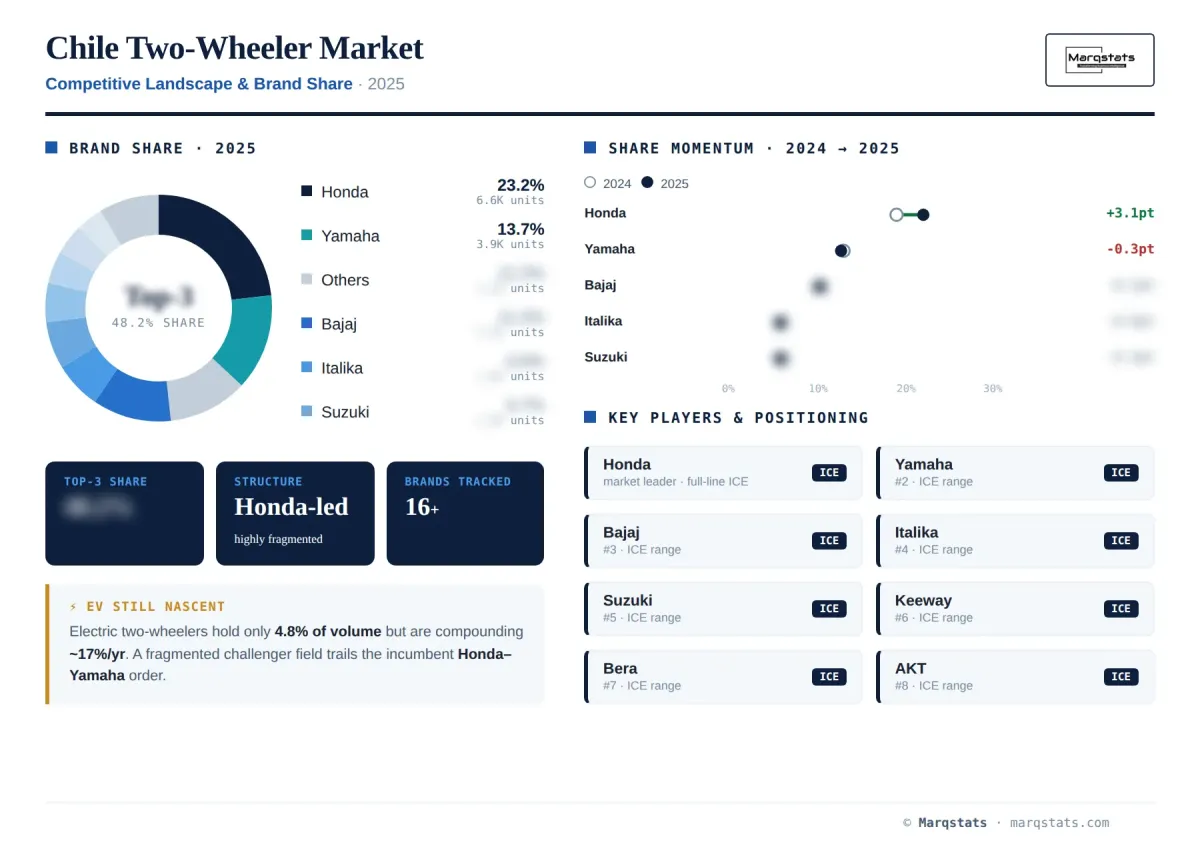
The Chile two-wheeler market is moderately concentrated. The five largest brands hold close to 62% of unit sales, ahead of a long tail of importers and value brands. Japanese marques anchor the premium and mid tiers, Indian brands hold strong entry and mid positions, and Chinese brands expand quickly at the value end and in electric models.
Competition centers on price, dealer and service coverage, financing access, and model breadth. Importers compete on landed cost and availability, owing to exchange-rate exposure and freight timing. Premium marques compete on brand strength, touring range, and after-sales support. Electric entrants compete on running cost, battery performance, and courier-focused rental and fleet programs.
Brand strategy also reflects propulsion shifts. Established combustion marques extend ranges into electric commuter and delivery models to defend share. New electric entrants target courier fleets first, owing to predictable duty cycles and cost-driven purchasing. Aftermarket parts availability and battery support influence buyer confidence, and brands that secure service coverage gain an advantage in retention and resale value.
Distribution strategy is a growing point of difference. Brands that build online sales and courier partnerships gain share as e-commerce scales. Service network depth remains decisive for premium and high-capacity sales, where buyers value maintenance support and resale value.
Pricing discipline is constrained by exchange-rate exposure, so importers compete on availability and financing as much as on headline price. Brands with broad model ranges capture demand across commuting, delivery, and recreation, which strengthens their position against single-segment entrants. Financing partnerships and courier fleet contracts increasingly determine volume gains, owing to the concentration of high-mileage buyers in delivery. Marques that pair competitive pricing with reliable parts supply hold share most effectively during periods of peso depreciation.
Companies Covered
The report profiles 16+ companies with full strategy and financials analysis, including:
Recent Market Activity
Table of Contents
Coverage & Segmentation
This report provides a comprehensive analysis of the Chile two-wheeler market across 2021 to 2030, with 2025 as the base year and 2026 to 2030 as the forecast period. The study measures market size in unit volumes and revenue, and it segments demand by vehicle type, propulsion type, engine displacement and motor power, price band, end user, sales channel, and brand.
The report examines demand drivers, restraints, and trends, along with competitive structure and brand positioning. Regional coverage spans the Metropolitan Region, Valparaíso, the northern mining regions, and Biobío and the south. The analysis integrates import records, registration data, and primary interviews to reconcile brand-level and category-level estimates into a single market view.
The study also assesses distribution shifts, electrification, and the balance between private and commercial demand. Forecasts are built at the segment level and reconciled to the total market, so that vehicle type, propulsion, displacement, price band, end user, and channel views remain internally consistent. Historical anomalies, including the 2021 import surge, are treated as one-off events rather than trend indicators.