Market Snapshot
The Canada used car market size is estimated at USD 55,329.80 million in 2025 and is projected to reach USD 68,608.53 million by 2030, growing at a CAGR of 4.40% over 2026 – 2030. Transactions rise from 3,240,000 to 3,590,000 a year, while the average transaction value climbs from about CAD 23,870 to CAD 26,713.
Marqstats defines the market as the value of every used light vehicle that changes hands between a seller and an end buyer in Canada in a year: retail sales by franchised new-car dealers, retail sales by independent used-car dealers and private sales between individuals. Cars, SUVs and crossovers, pickups and minivans are counted; dealer-to-dealer auction trades, exports to the United States, heavy trucks and motorcycles are not. Values are transaction prices before GST, HST, PST and QST, converted at the 2025 average of CAD 1.3978 per US dollar.
Franchised dealers account for 59.78% of 2025 value, SUVs and crossovers for 48.84% and gasoline and diesel vehicles for 90.87%. Ontario is the largest province at 38.40% of value, while Alberta grows fastest at 5.02% a year. Canada sells about 1.71 used vehicles for every new vehicle, against 1,897,055 new vehicles sold in 2025.
Key Takeaways
Market Overview & Analysis
Report Summary
Marqstats sizes the Canada used car market as the value of used light vehicles sold to end buyers in a year. Three channels are counted. Franchised new-car dealers retail trade-ins, lease returns and certified pre-owned vehicles; independent used-car dealers buy at auction and from the public and sell older stock; and private sellers sell directly to other individuals through classified sites. In 2025 these channels completed 3,240,000 transactions worth CAD 77,340.00 million, or USD 55,329.80 million at the 2025 average rate of CAD 1.3978 per US dollar.
Dealer-to-dealer trades are left out on purpose. A trade-in that a franchised dealer sends to an OPENLANE, Inc. digital auction and that an independent dealer then retails would otherwise be counted twice, so the market counts only the final sale to an end buyer. Exports to the United States are also excluded, because they leave the Canadian fleet, as are commercial trucks above light-duty weights, motorcycles and recreational vehicles.
The used market is about 1.71 times the size of the new market by units. The Canadian Automobile Dealers Association (CADA) reports 1,897,055 new vehicles sold in 2025, up 2.0%, through 3,778 franchised dealerships. Marqstats estimates 1,340,000 franchised used retail sales, 780,000 independent dealer sales and 1,120,000 private sales. The franchised figure equals about 355 used sales per dealership, which matches the 354 used vehicles a franchised dealer reported selling in 2025 in the January 2026 survey run by the UCDA with DesRosiers Automotive Consultants.
Prices rose through 2025 and eased in 2026. AutoTrader.ca put the average used vehicle price at CAD 35,494 in 2025, up just over 2%, against CAD 63,665 for a new vehicle in November 2025. Its Q2 2026 Price Index showed CAD 36,690 in June 2026, down 2.6% year on year, and Clutch Technologies Inc. reported an average sale of CAD 33,752 in August 2026, down 0.5%, its first annual decline since March 2025. These are prices of dealer stock. Private sales and older independent stock pull the average across all transactions down to about CAD 23,870 on Marqstats estimates.
Policy changed around the market rather than inside it. Prime Minister Mark Carney paused the 2026 target of the Electric Vehicle Availability Standard on 5 September 2025 and ordered a 60-day review, the Bank of Canada cut its policy rate to 2.25% on 29 October 2025 and held it there through 2 September 2026, and the Electric Vehicle Affordability Program opened on 16 February 2026 with rebates of up to CAD 5,000 for new battery-electric vehicles. Used vehicles do not qualify for the federal rebate except demonstrators with less than 10,000 kilometres.
Canada Used Car Market Size and Forecast
The Canada used car market grows from USD 55,329.80 million in 2025 to USD 68,608.53 million in 2030, a CAGR of 4.40%. Volume and price both contribute: transactions rise at 2.07% a year, from 3,240,000 to 3,590,000, and the average transaction value rises at 2.28% a year, from about USD 17,077 to USD 19,111, or from about CAD 23,870 to CAD 26,713.
The 2025 value is built bottom-up by channel. Marqstats estimates 1,340,000 franchised dealer sales at an average of CAD 34,500, 780,000 independent dealer sales at CAD 20,500 and 1,120,000 private sales at CAD 13,500. The franchised price sits slightly below the CAD 35,494 AutoTrader.ca listing average because sold units skew to the cheaper end of listed stock, and Clutch Technologies Inc. sale prices near CAD 33,800 support that level. Independent and private prices reflect older stock: in the UCDA survey the hardest vehicles to source were four to twelve years old, which pushes independents toward vehicles of eight years and more.
The total is consistent with the Canada slice of the live Marqstats North America Used Car Market page, which puts Canadian transactions at about 3.24 million and the Canadian average at about USD 17,523. The two analyses use the same transaction count. In Canadian dollars the averages differ by less than 1%; the US dollar figure here is about USD 17,077 because Marqstats now applies the verified 2025 average of CAD 1.3978 per US dollar. The Canada figures here are a slice of that regional market and should not be added to it.
Growth is uneven through the period. Marqstats estimates 2026 at about 3,279,000 transactions worth about USD 55,547.84 million, as unit sales recover slightly while dealer and auction prices ease from their 2025 highs, before growth picks up from 2027 as younger vehicles return. Franchised dealers grow at 5.21% a year in value, independent dealers at 3.31% and private sales at 2.96%.
Marqstats tracks four indicators to monitor the forecast: new vehicle sales and lease penetration, which set the supply of trade-ins three to four years later; the Canadian dollar against the US dollar, which sets the pull of the export trade; Canadian Black Book wholesale values against their seasonal norm; and the Bank of Canada policy rate, which drives floorplan costs and the monthly payment on 72-month and 84-month used vehicle loans.
Market Dynamics
Key Drivers
Five forces keep transaction counts rising and lift the value of each sale.
- A large and ageing fleet needs replacement. Canada sold 1,897,055 new vehicles in 2025 and about 1.71 used vehicles for each of them,. Owners who keep vehicles longer still trade down or across at some point, which keeps private and independent sales steady even when new sales stall.
- New vehicles cost about CAD 27,000 more than used ones. AutoTrader.ca put the average new vehicle at CAD 63,665 in November 2025 against CAD 35,494 for a used vehicle, and CAD 63,016 against CAD 36,690 in June 2026. Households pushed out of the new market buy late-model used vehicles instead, which lifts franchised and certified pre-owned demand.
- Lower interest rates help buyers who finance. The Bank of Canada cut its policy rate to 2.50% on 17 September 2025 and 2.25% on 29 October 2025 and held it at 2.25% at seven straight decisions through 2 September 2026. In the UCDA January 2026 survey 59.5% of used purchases were financed with a dealer-arranged loan and 36.5% were paid in cash.
- Dealers expect to sell more. Respondents to the UCDA survey sold an average of 214 used vehicles in 2025 and expect 247 in 2026, with franchised dealers rising from 354 to 405 and independents from 173 to 201. AutoCanada Inc. retailed 11,499 used vehicles in the second quarter of 2026, up 10.0%, and cut used days of supply from 63 to 54.
- SUVs and pickups carry higher prices. Cardog listing data for 2025 put used pickups at an average of CAD 67,146 and SUVs at CAD 44,447 against CAD 31,319 for sedans, and SUVs made up 52% of AutoTrader.ca used listings. As each year's used supply contains fewer sedans, the average value of a used sale rises even when like-for-like prices are flat.
Key Restraints
Four constraints squeeze dealer margins and slow the flow of younger stock.
- Young vehicles leave for the United States. DesRosiers Automotive Consultants found that 40.1% of 2024 used exports to the United States were up to two years old and 34.7% were three to five years old. With the Canadian dollar falling from about US$0.721 in early September 2026 to about US$0.704 on 3 October 2026, US buyers still find Canadian stock cheap, and franchised dealers lose the vehicles they would sell as certified pre-owned.
- Dealer margins have collapsed. AutoCanada Inc. reported used gross profit per unit of CAD 442 in the fourth quarter of 2025, down 75.9%, and CAD 587 in the second quarter of 2026, down 66.9%, as it cleared stock bought at high prices. Holding costs of about CAD 30 to CAD 45 per vehicle per day mean a unit that sits 60 days can lose more than the dealer earns on it.
- Mid-age stock is hard to find. In the UCDA January 2026 survey 49.1% of dealers said their ability to source used vehicles got worse over six months and only 9.8% said it improved, and the hardest vehicles to source in 2025 were four to twelve years old. Fewer new vehicles sold and leased in 2021 to 2023 means fewer three- to five-year-old vehicles today.
- Electric vehicles sell slowly in the used channel. In the UCDA survey 71.1% of independent dealers sold no used battery-electric vehicles in 2025 and 21.1% said they made up 1% to 5% of sales, and the federal rebate does not apply to used vehicles. Dealers who take electric trade-ins carry pricing risk because new-vehicle price cuts and the rebate reset what buyers will pay.
Key Trends
Four shifts are changing what is sold, who sells it and how buyers find it.
- Wholesale moves online. OPENLANE, Inc. sold nearly 1.5 million vehicles in 2025 with gross merchandise value of about US$29 billion, up 6%, and its marketplace dealer volume grew 15%, while the company named a challenging fourth quarter in Canada as a headwind. Digital auctions shorten the time a trade-in spends between dealers.
- Buying starts online and ends on the lot. In the UCDA survey 53.4% of used sales were completed entirely in the dealership, 39.8% began online and closed in the store, and 6.9% were completed online, with independents at 8.5%. Clutch Technologies Inc. and Canada Drives sell fully online with home delivery.
- Electrified used prices hold up better. Clutch Technologies Inc. reported used electric vehicle prices up 1.2% year on year like for like in August 2026, the only fuel type to rise, while gasoline vehicles fell 2.4%, and Tesla fell to 22.5% of its used electric sales from 32.2%. AutoTrader.ca reported used EV prices up 0.4% in Q2 2026.
- Dealer groups trade stores for service and collision capacity. AutoCanada Inc. sold its remaining US stores and three British Columbia dealerships for CAD 49.2 million after the second quarter of 2026 while buying collision centres in Calgary, Thunder Bay and Stratford. Used vehicles are becoming a source of trade-ins and service work for dealers more than a profit centre of their own.
Strategic Implications
- For franchised dealers, the priority is keeping trade-ins in Canada. A vehicle bought at the service drive or on lease return avoids an auction fee and the US bidder. Dealers that offer owners of three- to five-year-old vehicles a firm trade price before the vehicle reaches the wholesale lane secure the certified pre-owned stock that sells fastest.
- For independent dealers, profit comes from turning stock, not from price. With holding costs of about CAD 30 to CAD 45 a day and wholesale values falling slowly, a 45-day turn protects margin better than waiting for a higher retail price. Reconditioning capacity for vehicles of eight to twelve years is the main capital need.
- For online retailers and marketplaces, the opening is the hybrid buyer. Hybrid and plug-in hybrid sales are the fastest-growing value segment on Marqstats estimates, and online retailers that publish battery and hybrid system condition alongside the price can charge for the confidence that many lots cannot give.
- For lenders, longer loans on older vehicles raise loss risk. Most used purchases are financed at the dealership, and 72-month and 84-month terms on vehicles already four years old outlast the warranty. Lenders that price loans by vehicle age and powertrain, rather than by model year alone, protect their books when used EV and older vehicle prices move.
- For auction and inspection providers, the gap is battery health data. Used electric vehicles sell slowly at independent dealers because buyers cannot see battery condition, and a standard condition score in auction reports would let dealers price electric trade-ins with less discount.
Market Segmentation
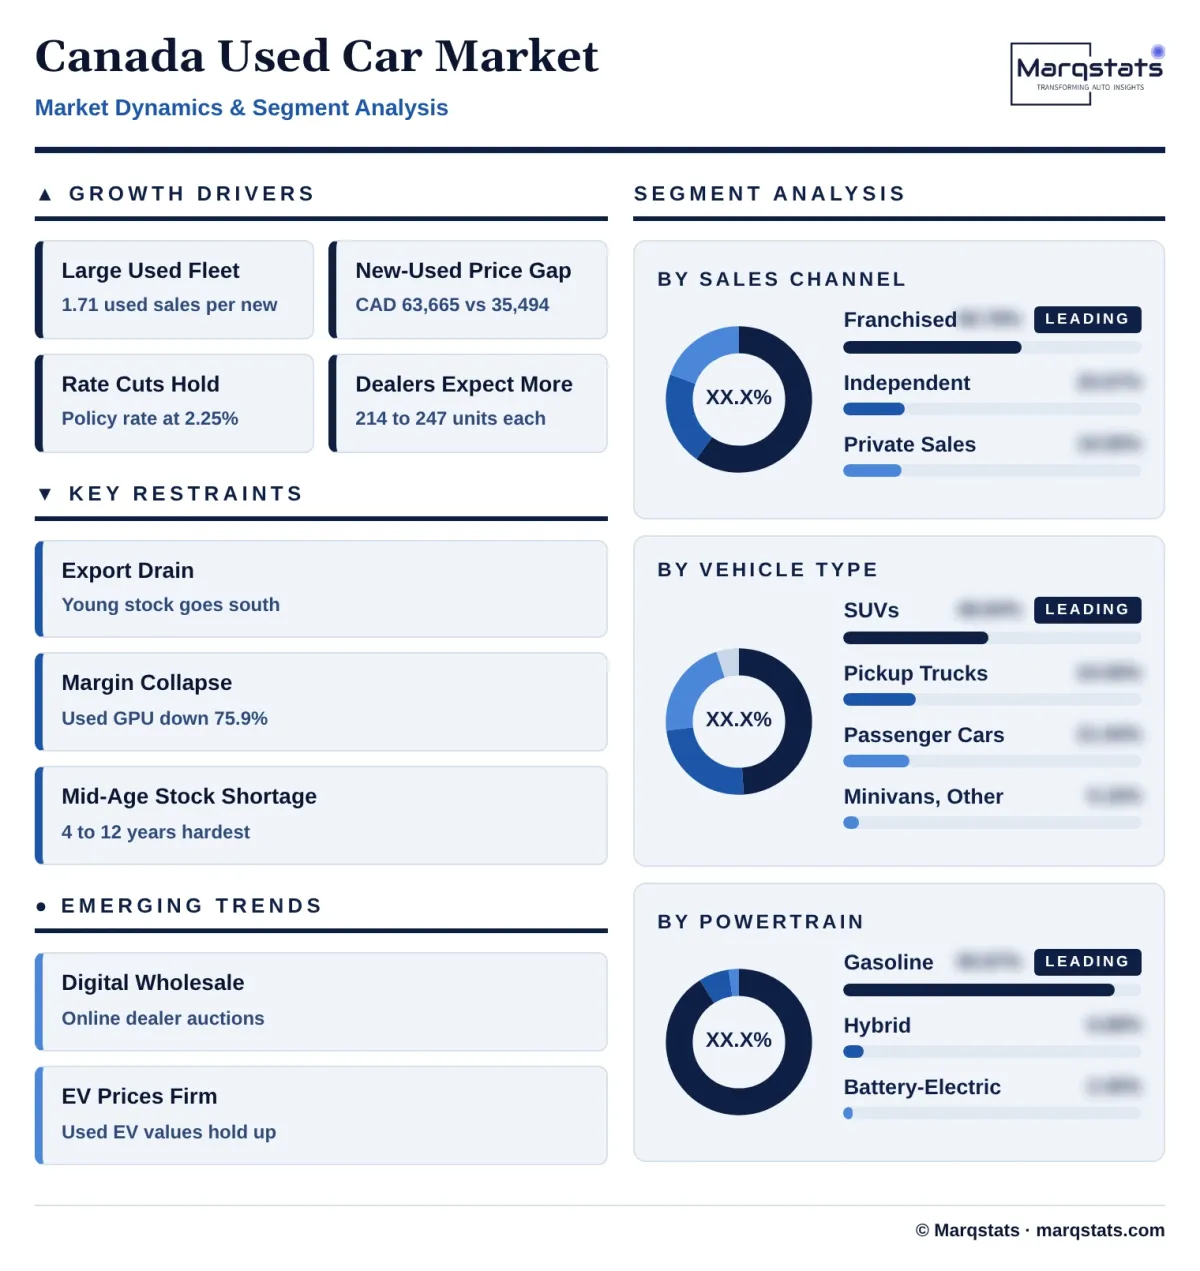
Franchised new-car dealers account for 59.78% of 2025 value, USD 33,073.40 million, from 1,340,000 retail sales at an average of CAD 34,500, and grow fastest among channels, at 5.21% a year, to USD 42,632.71 million and 62.14% of value by 2030. They sell the youngest stock, including certified pre-owned programmes from Toyota Canada Inc., Honda Canada Inc., Ford Motor Company of Canada and General Motors of Canada, and gain most as lease returns recover.
Independent used-car dealers account for 20.67% of 2025 value, USD 11,439.40 million, from 780,000 sales at an average of CAD 20,500, and grow at 3.31% a year to USD 13,461.15 million. At the 173 vehicles an independent reported selling in the UCDA survey, this volume implies about 4,500 active independent retailers, most buying at auction and from the public and selling vehicles of eight years and older.
Private sales between individuals account for 19.55% of 2025 value, USD 10,817.00 million, from 1,120,000 transactions at an average of CAD 13,500, and grow at 2.96% a year to USD 12,514.67 million. Kijiji Autos, AutoTrader.ca and Facebook Marketplace carry private listings, and provincial registries record the transfer; private sales hold a large share of units but a smaller share of value because the vehicles are older.
SUVs and crossovers account for 48.84% of 2025 value, USD 27,021.53 million, and 46.00% of transactions, and grow at 6.13% a year to USD 36,376.11 million and 53.02% of value by 2030. The Nissan Rogue, Honda CR-V and Toyota RAV4 were among the five best-selling used models on Clutch in August 2026.
Passenger cars, sedans and hatchbacks account for 21.94% of 2025 value, USD 12,140.11 million, and 31.00% of transactions, falling to 25.50% of transactions by 2030 while value is flat at -0.02% a year. Fewer new sedans have been sold for a decade, so used supply shrinks, although the Honda Civic and Toyota Corolla still sell quickly.
Pickup trucks account for 24.06% of 2025 value, USD 13,314.96 million, from 17.00% of transactions, and grow at 4.56% a year to USD 16,642.66 million. The Ford F-150, GMC Sierra 1500 and Chevrolet Silverado 1500 carry the highest used prices of any body type and are the vehicles US buyers most often import from Canada.
Minivans and other light vehicles account for 5.16% of 2025 value, USD 2,853.21 million, and grow at 3.96% a year to USD 3,464.39 million. The Chrysler Pacifica, built in Windsor, Ontario, Toyota Sienna and Kia Carnival lead a small but steady segment bought by families and by small businesses.
Gasoline and diesel vehicles account for 90.87% of 2025 value, USD 50,278.10 million, and 92.60% of transactions, and grow at 2.23% a year to USD 56,152.57 million, while their share of value falls to 81.84%. Nearly every vehicle older than eight years in the fleet runs on gasoline, so private and independent sales stay mostly conventional through 2030.
Hybrids and plug-in hybrids account for 6.68% of 2025 value, USD 3,694.30 million, and grow fastest in value, at 18.79% a year, to USD 8,739.98 million and 12.74% of value by 2030. Hybrids were 6.5% of Clutch sales in August 2026, and Cardog listing data put the average used hybrid about 26% above a gasoline vehicle, led by the Honda CR-V Hybrid.
Battery-electric vehicles account for 2.45% of 2025 value, USD 1,357.40 million, and 2.00% of transactions, and grow at 22.31% a year to USD 3,715.98 million and 5.42% of value. The Chevrolet Equinox EV, Ford Mustang Mach-E and Tesla Model 3 are the most listed used models, and used EV prices rose 1.2% like for like on Clutch in August 2026.
Vehicles up to three years old account for 39.65% of 2025 value, USD 21,934.95 million, from 21.00% of transactions, and grow at 4.82% a year to USD 27,760.68 million. These are the vehicles most exposed to the export trade, since 40.1% of 2024 exports to the United States were up to two years old.
Vehicles of four to seven years account for 32.25% of 2025 value, USD 17,846.40 million, and grow fastest among age bands, at 5.40% a year, to USD 23,218.02 million as vehicles sold after the 2021 to 2023 supply shortage reach this age. Dealers in the UCDA survey named this band among the hardest to source in 2025.
Vehicles of eight to twelve years account for 20.33% of 2025 value, USD 11,250.99 million, from 29.00% of transactions, the largest share of units, and grow at 2.38% a year to USD 12,654.54 million. They are the core stock of independent dealers and of private sales.
Vehicles of thirteen years and older account for 7.77% of 2025 value, USD 4,297.46 million, from 24.00% of transactions, and grow at 2.97% a year to USD 4,975.29 million. Average values are low, and provincial safety inspections and road salt corrosion limit how long these vehicles stay in service.
By Geography
Ontario
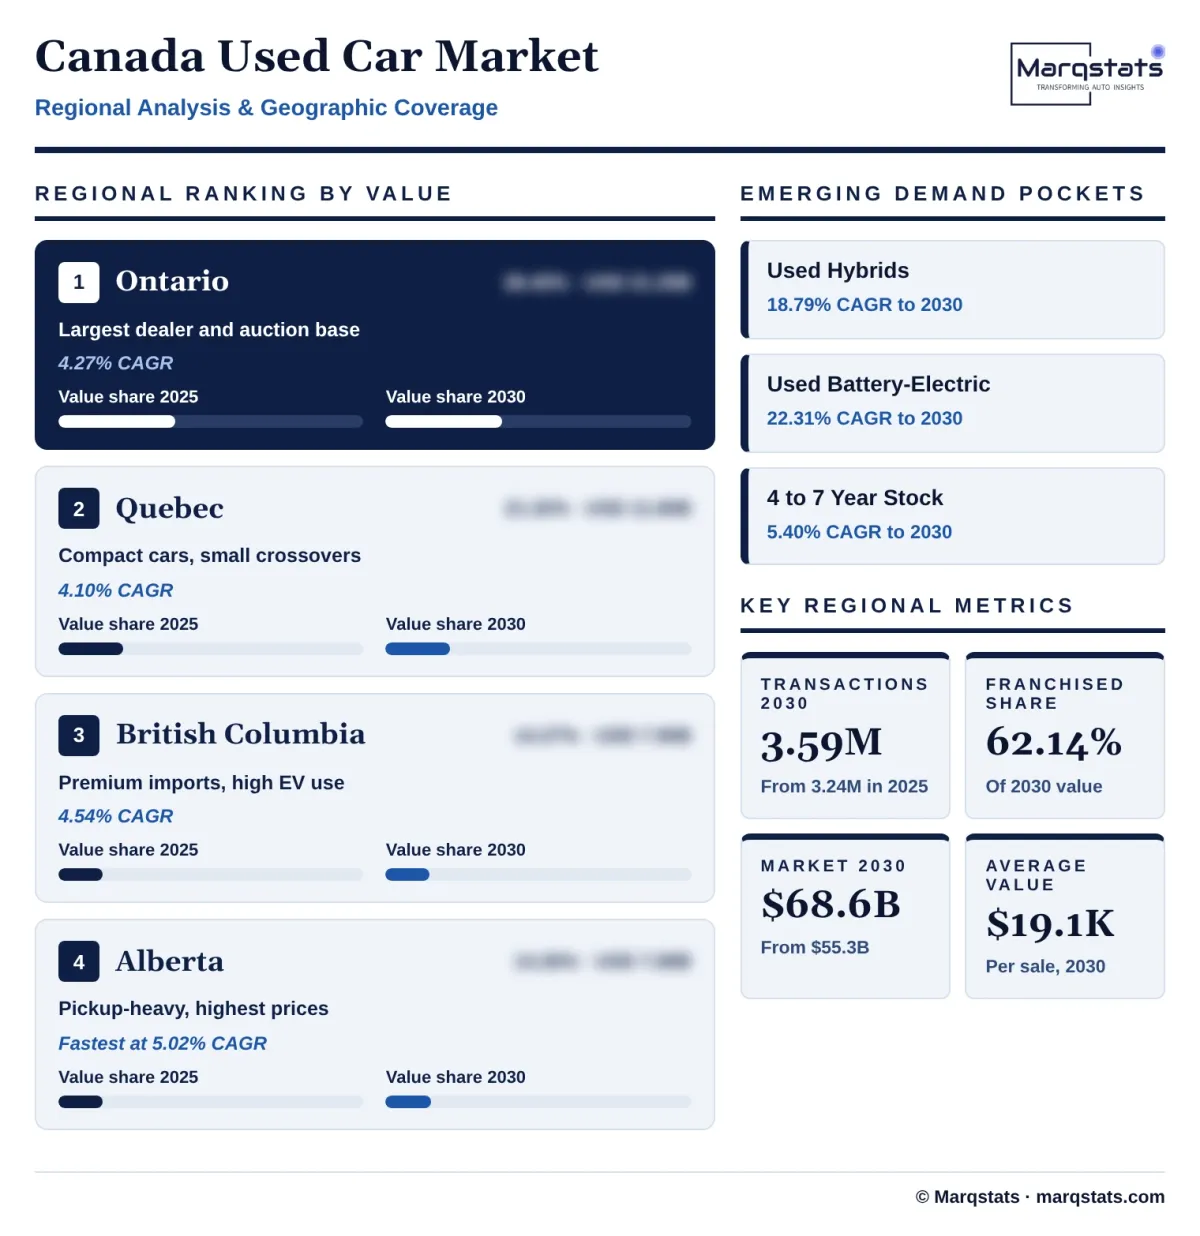
Ontario accounts for 38.40% of 2025 value, USD 21,245.67 million, and 38.50% of transactions, and grows at 4.27% a year to USD 26,191.68 million. It holds the largest dealer base and the main wholesale auction sites around the Greater Toronto Area, and dealers there work under the Ontario Motor Vehicle Industry Council (OMVIC), which requires all-in advertised prices. Ontario carried 43.6% of 2025 Cardog used listings.
Quebec
Quebec accounts for 21.32% of 2025 value, USD 11,795.49 million, and 22.50% of transactions, and grows at 4.10% a year to USD 14,422.52 million. Buyers lean more toward compact cars and small crossovers than in the west, which keeps the average value per sale below Ontario, and GST and QST together add 14.975% to dealer sales.
British Columbia
British Columbia accounts for 14.27% of 2025 value, USD 7,896.77 million, and grows at 4.54% a year to USD 9,858.47 million. Average listing prices ran about 6.7% above the national average in 2025 on Cardog data, driven by Lower Mainland demand for premium imports and the highest electric vehicle adoption of any province.
Alberta
Alberta accounts for 14.26% of 2025 value, USD 7,891.25 million, and grows fastest, at 5.02% a year, to USD 10,080.04 million and 14.69% of value by 2030. Average listing prices ran about 10.6% above the national average in 2025, because full-size four-wheel-drive pickups dominate demand in energy, construction and farming, and the province has no provincial sales tax.
Manitoba and Saskatchewan
Manitoba and Saskatchewan account for 6.48% of 2025 value, USD 3,586.93 million, and grow at 4.38% a year to USD 4,445.06 million. Pickups and SUVs for farm and rural use set the mix, and Manitoba Public Insurance and Saskatchewan Government Insurance handle registration and the safety rules for transfers.
Atlantic Canada and Territories
Atlantic Canada and the territories account for 5.27% of 2025 value, USD 2,913.69 million, and grow at 4.38% a year to USD 3,610.76 million. Listing prices in Nova Scotia ran about 20.0% below the national average in 2025 on Cardog data, and dealers bring much of their stock from Ontario and Quebec auctions.
How Competition Is Evolving
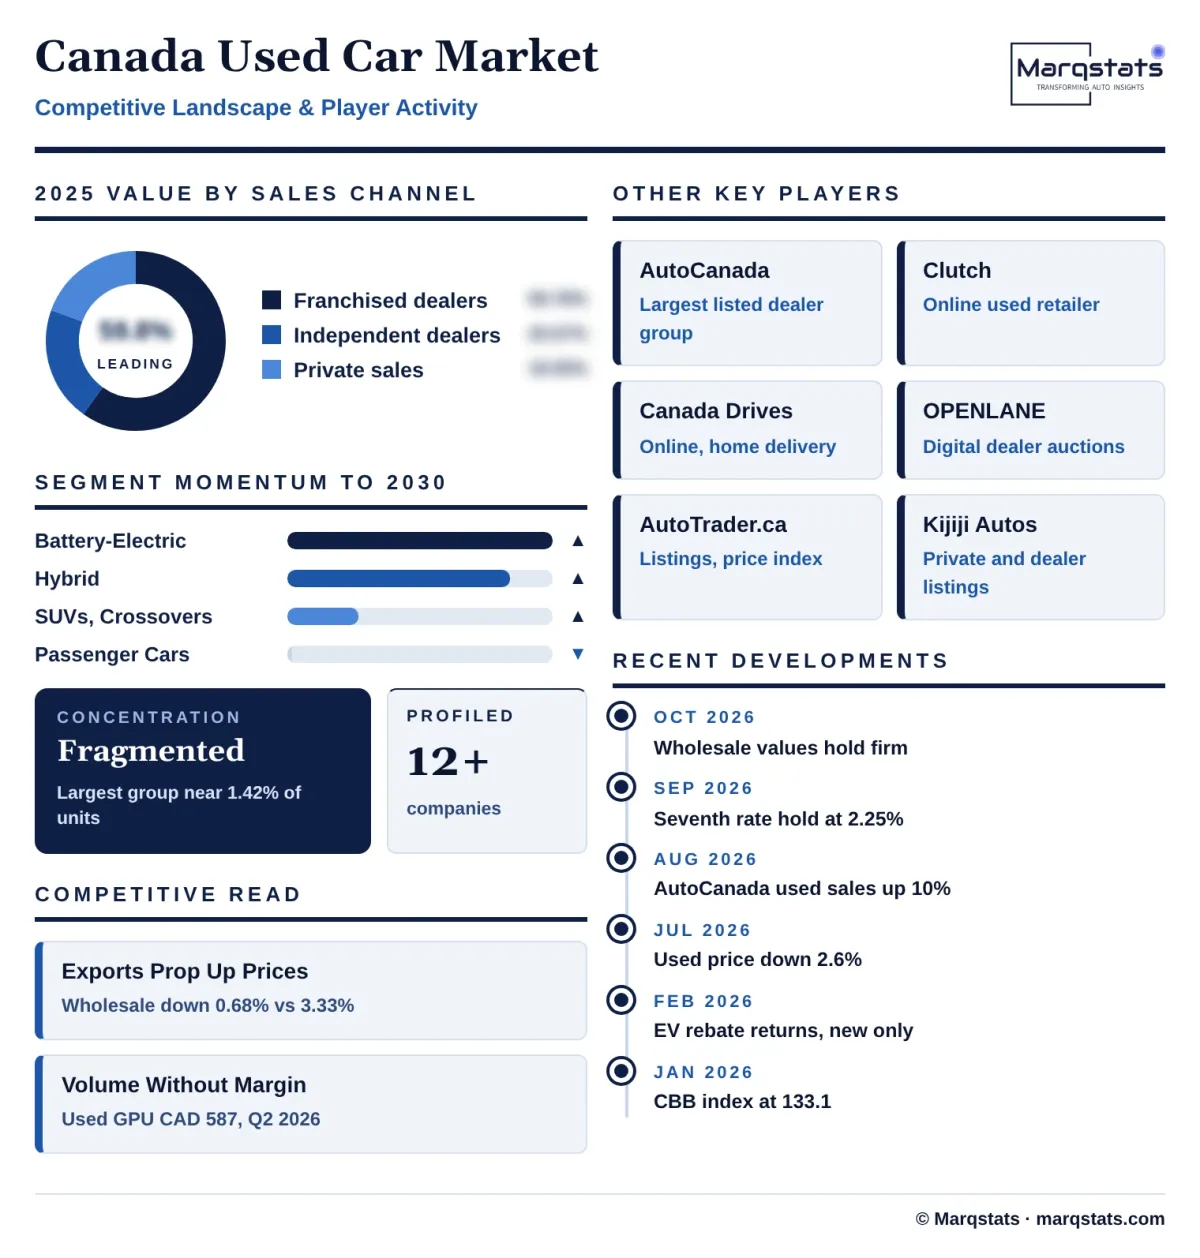
The market is highly fragmented. AutoCanada Inc., the largest listed dealer group, retailed 11,499 used vehicles in the second quarter of 2026, an annual rate equal to about 1.42% of 2025 transactions. Franchised dealers as a group hold 59.78% of value across 3,778 stores, independent dealers 20.67% across about 4,500 retailers on Marqstats estimates, and private sellers 19.55%. No retailer, platform or auction holds a share large enough to set prices.
Franchised groups compete on stock and certified programmes. AutoCanada Inc. operated 64 franchised dealerships, three independent used dealerships and 33 collision centres in Canada at the end of 2025, and other large groups include the Dilawri Group of Companies, Go Auto and Steele Auto Group. Carmaker certified pre-owned programmes from Toyota Canada Inc., Honda Canada Inc., Hyundai Auto Canada Corp., Ford Motor Company of Canada and General Motors of Canada add warranty cover that independents cannot easily match.
Online retailers and marketplaces compete for the buyer before the lot does. Clutch Technologies Inc. and Canada Drives sell used vehicles online with delivery, while AutoTrader.ca, operated by Trader Corporation, Kijiji Autos and CARFAX Canada control much of the search and vehicle history that buyers see. In the UCDA survey only 6.9% of used sales were completed fully online, so these platforms win more often as lead sources than as sellers.
Wholesale competition decides who gets the young stock. OPENLANE, Inc. runs the largest digital dealer-to-dealer marketplace in Canada, and US exporters bid against Canadian dealers for the same two- to five-year-old vehicles. When the Canadian dollar is weak, exporters win more of these vehicles, which is why dealers with strong service-drive buying programmes hold an advantage.
Companies Covered
Companies covered in the report include:
Recent Market Activity
Table of Contents
Coverage & Segmentation
The study covers the Canada used car market, with 2025 as the base year, 2021 – 2025 as the historical period and 2026 – 2030 as the forecast period. It covers used light vehicles sold to end buyers in Canada through franchised dealers, independent dealers and private sales, segmented by sales channel, vehicle type, powertrain, vehicle age and province. Values are transaction prices before sales taxes, in US dollars at the 2025 average of CAD 1.3978 per US dollar.
Dealer-to-dealer auction and wholesale trades, exports of used vehicles to the United States, new vehicles, heavy trucks, buses, motorcycles and recreational vehicles are excluded. Channel, segment and provincial splits are Marqstats estimates built from dealer counts, dealer survey volumes, listing and sale prices and provincial price differences. The live Marqstats North America Used Car Market page includes Canada as a slice, and the Pre-Owned Luxury Car Market page overlaps the premium end of the Canadian market; their figures should not be added to this market.