Market Snapshot
The UK light commercial vehicle market size is estimated at USD 14,091.26 million in 2025 and is projected to reach USD 18,256.43 million by 2030, growing at a CAGR of 5.32% over 2026 – 2030. New registrations are 315,422 vans in 2025 and rise to 354,000 by 2030, a 2.33% annual rate, while the average net price per van climbs from about USD 44,674 to USD 51,572 as battery-electric vans take a larger share of registrations.
Marqstats defines the market as the net transaction value of new light commercial vehicles of up to 3.5 tonnes gross vehicle weight (type-approval category N1) registered for the first time in the United Kingdom, as recorded by the Society of Motor Manufacturers and Traders (SMMT). The market covers panel vans, chassis cabs, double-cab pickups and commercial 4x4s, valued before VAT and before any body conversion. Electric rigids of 3.5 to 4.25 tonnes, heavier trucks, passenger cars, used vans and conversion upfit value are excluded.
Large vans of more than 2.5 to 3.5 tonnes account for 69.92% of 2025 value, diesel vans for 83.56% and England for 86.00%. Battery-electric vans are the fastest-growing powertrain, at 30.40% a year in value, but reached only 8.81% of 2025 registrations against a 16% mandate for the year.
Key Takeaways
Market Overview & Analysis
Report Summary
Marqstats sizes the UK light commercial vehicle market as the net transaction value of new vans, chassis cabs, pickups and commercial 4x4s of up to 3.5 tonnes gross vehicle weight registered in the United Kingdom each year. The unit base is the SMMT registration series, which is published in full for 2025, and value is built by multiplying units in five SMMT size and type classes by Marqstats estimates of net prices before VAT. Electric rigids of 3.5 to 4.25 tonnes that drivers may operate on a car licence under the Category B derogation are measured but sit outside the market.
The market is large, but it shrank in 2025. SMMT recorded 315,422 new vans, pickups and 4x4s in 2025, down 10.3% from 351,834 in 2024, after a year in which economic uncertainty, weak business confidence and the pickup tax change reduced orders. The only month of growth was December, at 27,694 vans, up 1.7%. The fall was concentrated in medium vans of more than 2.0 to 2.5 tonnes, down 20.7% to 51,639, and in large vans, down 9.8% to 210,262, while small vans rose 1.9% to 8,766 and 4x4s rose 2.3% to 7,447.
The installed base is far larger than the annual flow. The Department for Transport (DfT) counted about 4.90 million licensed light goods vehicles at the end of September 2025, of which 106,000, or 2.2%, were electric, and 89,000 light goods vehicles were registered for the first time in the third quarter of 2025, of which 9.8% were zero-emission. The registered base turns over slowly, which is why a market of roughly 300,000 vans a year can take well over a decade to change its powertrain mix.
Policy sets the pace of change. The Zero Emission Vehicle mandate, made under the Vehicle Emissions Trading Schemes Order 2023, requires manufacturers to sell 16% zero-emission vans in 2025 and 24% in 2026, rising to 70% in 2030 and 100% in 2035. On 14 August 2026 DfT opened a review of the mandate that closed on 23 October 2026, with options of 70%, 60%, 50% or 40% for 2030 under discussion. The Plug-in Van Grant, announced for extension on 18 August 2025, pays up to GBP 2,500 on small vans and up to GBP 5,000 on large vans to at least 2027.
Domestic supply has shrunk. Stellantis built its last Vauxhall Vivaro at Luton on 28 March 2025 and moved electric van assembly to Ellesmere Port, and SMMT reported UK commercial vehicle output of 47,344 units in 2025, down 62.3%, with Stellantis commercial vehicle output of about 31,000 against 105,000 in 2024. The registered market is therefore supplied mainly by imports, and sterling values in this analysis are converted at the 2025 average of GBP 1 = USD 1.32.
UK Light Commercial Vehicle Market Size and Forecast
The UK light commercial vehicle market grows from USD 14,091.26 million in 2025 to USD 18,256.43 million in 2030, a CAGR of 5.32%. Volume grows at 2.33% a year: registrations rise from 315,422 to 354,000 vans as the replacement cycle resumes and fleets work through deferred orders. The rest comes from price and mix, with the average net price per van rising at 2.91% a year from about USD 44,674 to USD 51,572 as battery-electric vans, which cost more than diesel vans, grow from 8.81% to 28.25% of registrations.
The 2025 value is built bottom-up from SMMT units and Marqstats estimates of net transaction prices before VAT. Marqstats applies GBP 19,500 to 8,766 small vans, GBP 25,000 to 51,639 medium vans, GBP 35,500 to 210,262 large vans, GBP 36,500 to 37,308 pickups and GBP 52,000 to 7,447 commercial 4x4s, which gives about GBP 10.68 billion, or USD 14,091.26 million at GBP 1 = USD 1.32. The large-van price sits above the 2023 launch price of the Ford Transit Custom Leader, GBP 32,350 before VAT, because the mix includes Transit and Sprinter vans and electric versions; each GBP 1,000 change in the average price moves the market by about USD 416.36 million.
The unit forecast rests on year-to-date registrations. SMMT data for January to September 2026 give 251,375 vans, 4.19% above the 241,264 registered a year earlier, with six consecutive months of growth to September and September itself at 49,704 vans, up 4.8%. Marqstats estimates 2026 at 330,280 vans, 4.71% above 2025, by assuming the final quarter grows about 6.4%, because large and medium vans are rising while pickups continue to fall; this is above the 314,000 outlook SMMT published in May 2026, which pre-dates the run of growth months. Registrations then rise to 354,000 by 2030.
Electric vans add value faster than volume. Marqstats estimates battery-electric vans at 33,300 units in 2026 (10.08% of registrations), rising to 100,000 units in 2030 (28.25%), a 29.19% annual rate in units. Diesel falls from 269,301 vans in 2025 to 222,000 in 2030, and other powertrains, which include petrol, hybrid and plug-in hybrid vans, rise from 18,332 to 32,000. Marqstats assumes an electric premium over a comparable diesel van of GBP 7,500 in 2025, narrowing to GBP 5,000 by 2030 as battery costs fall and the Plug-in Van Grant continues.
The 2030 share of 28.25% is deliberately below the mandate. The statutory target is 70% in 2030, and the 2026 consultation floats 60%, 50% and 40%. Marqstats estimates the in-scope electric share at 10.08% in 2026 against 24%, and the gap to the current trajectory widens each year to 2029, because van payload limits, public charging costs, depot grid connections and the short financing horizon of small operators hold back adoption, as SMMT has said. Marqstats tracks four indicators to monitor the forecast: monthly SMMT registrations by fuel type, the outcome of the mandate review, the Plug-in Van Grant rates for 2026 to 2027, and used electric van values.
Market Dynamics
Key Drivers
Five forces keep new van registrations in the United Kingdom close to 300,000 a year and are lifting the value of each van.
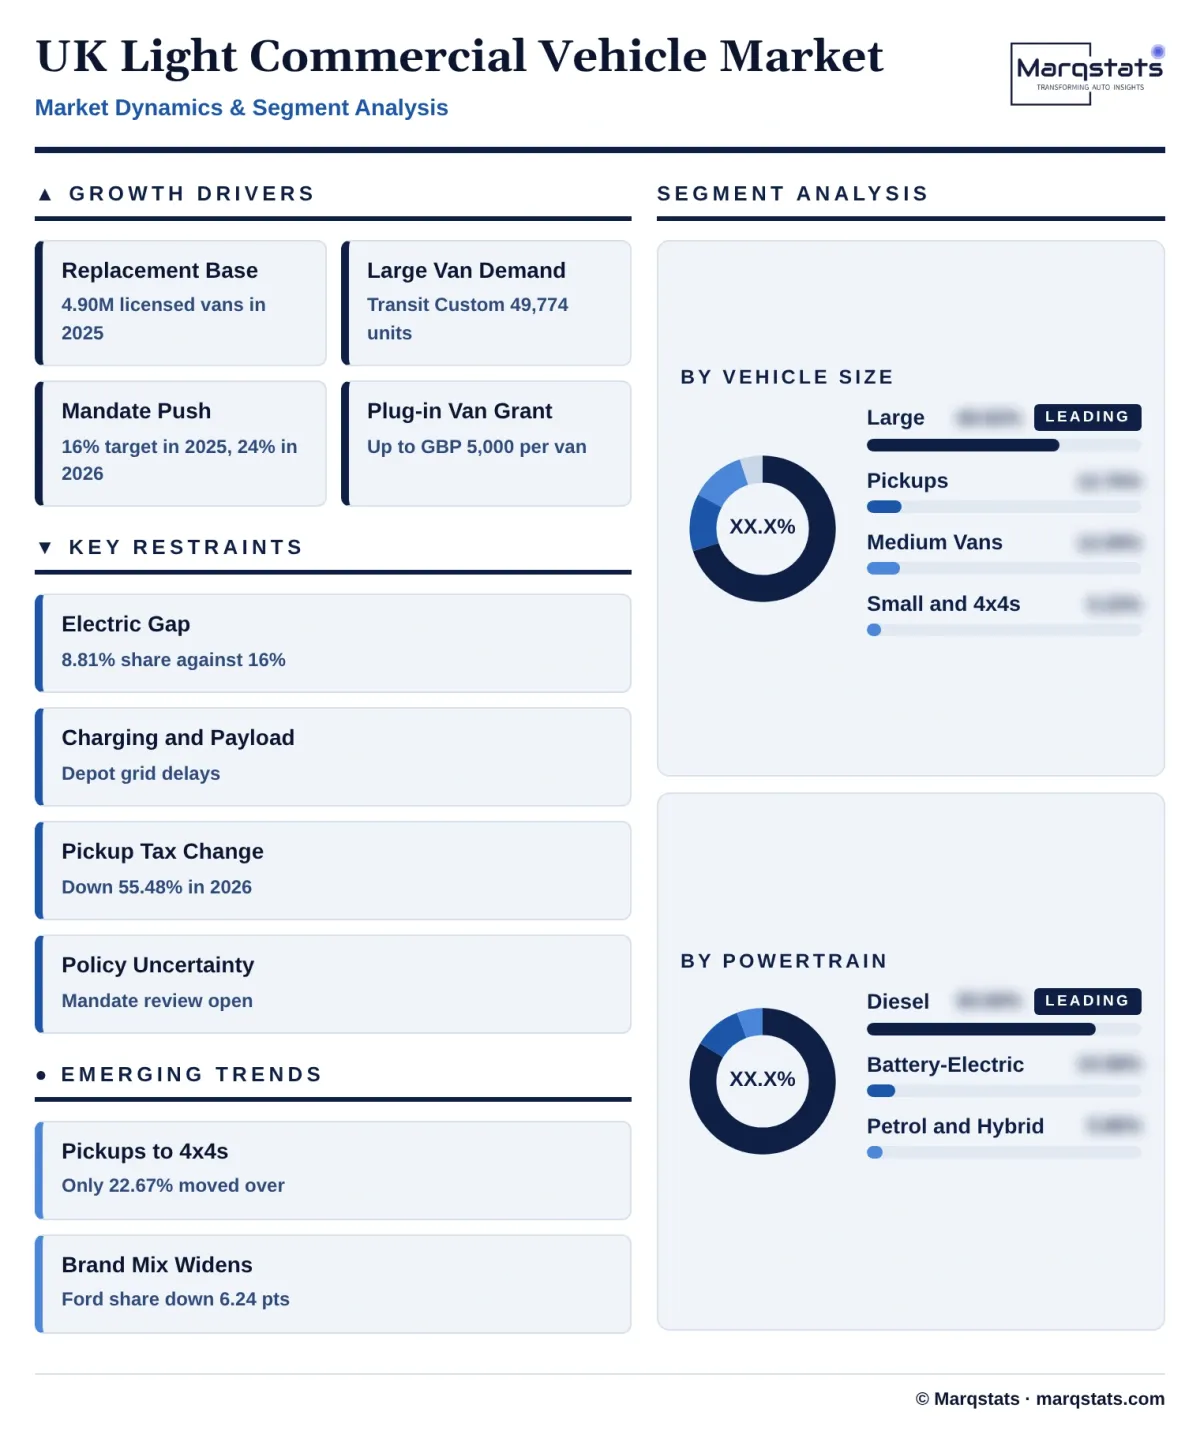
- A very large registered base needs steady replacement. DfT counted about 4.90 million licensed light goods vehicles at the end of September 2025, and 89,000 vans were registered for the first time in the third quarter alone. Fleets that deferred orders in 2025, when registrations fell 10.3% to 315,422, have to renew ageing vans, and year-to-date registrations in 2026 were already up 4.19% in January to September.
- E-commerce and trades work sustain large-van demand. Vans of more than 2.5 to 3.5 tonnes made up 66.66% of 2025 registrations and rose 14.04% in January to September 2026, led by the Ford Transit Custom, which registered 49,774 vans in 2025, the Ford Transit at 30,353 and the Mercedes-Benz Sprinter at 13,605. Parcel carriers, utilities and building trades buy these vans in batches through lessors.
- The zero-emission mandate forces manufacturers to push electric vans. With a 16% target in 2025 and 24% in 2026, manufacturers discount and launch models to move volume; SMMT reported almost GBP 400 million of discounts on electric vehicles in 2025, and electric vans rose 35.50% to 27,789 units. Models such as the Kia PV5 and the Ford E-Transit Custom add choice each year.
- Public support lowers the price of an electric van. The Plug-in Van Grant, extended on 18 August 2025 to at least 2027, takes up to GBP 2,500 off a small electric van and up to GBP 5,000 off a large one, and the Category B derogation lets drivers with a car licence operate electric vans up to 4.25 tonnes, which removes a driver-licensing barrier for small businesses.
- Commercial 4x4s and chassis cabs absorb demand that tax moved. Commercial 4x4s rose 67.67% in January to September 2026, to 9,222 vans, led by the Land Rover Defender, and chassis-cab buyers continue to feed the body-conversion industry, which Marqstats estimates converts about 50,000 vans a year.
Key Restraints
Four constraints hold back volume and slow the shift to electric vans.
- Electric vans trail the mandate. Battery-electric vans of up to 3.5 tonnes were 8.81% of 2025 registrations against 16%, and 9.72% in January to September 2026 against 24%. Manufacturers facing a widening gap discounted electric vehicles by almost GBP 400 million in 2025, according to SMMT, which squeezes margins and limits how fast they can push volume.
- Charging and payload limit the case for electrification. Public rapid charging costs far more than depot charging, grid connections for depots are slow to arrive, and SMMT cites limited van-suitable public charging as a barrier; heavier batteries also cut payload, which is why the 4.25 tonne derogation exists. Operators with no depot charging see little case for an electric van.
- Pickup demand has collapsed. From April 2025 HMRC treats most double-cab pickups as cars for benefit-in-kind and capital allowances, with employers who bought or ordered before 6 April 2025 keeping old treatment until the earliest of disposal, lease expiry or 5 April 2029. Pickup registrations fell 55.48% to 13,172 in January to September 2026, removing about 16,400 vans from the market.
- A weak economy and policy uncertainty delay orders. SMMT blamed weak business confidence for the 2025 decline and called for an urgent review of the mandate, while the review launched on 14 August 2026 left manufacturers and fleets unsure of the targets for 2027 to 2030 until the government responds. Buyers who can wait often do.
Key Trends
Four shifts are changing which vans are built, taxed and bought in the United Kingdom.
- Demand shifts from pickups to vans and 4x4s. Medium vans rose 4.81% and large vans 14.04% in registrations for January to September 2026, while pickups fell 55.48% and commercial 4x4s rose 67.67%. Marqstats expects pickups to settle near 22,000 a year by 2030, well below the 37,308 of 2025.
- Monthly electric share swings with volume. Electric vans took a record 16.3% of an August 2026 market of 14,445 vans, against 10.8% for January to September on the SMMT basis, and the monthly record says more about low August volumes than about fleet adoption. Annual and year-to-date shares are the better measure.
- Brand mix is widening. Ford held 35.77% of registrations in January to September 2025 and 29.53% in the same months of 2026, while Volkswagen rose from 10.20% to 11.88%, and new entrants such as Kia and Chinese-owned Maxus add choice in electric vans.
- Domestic assembly consolidates around electric vans. Stellantis closed Luton on 28 March 2025 and is moving electric van assembly to Ellesmere Port, so UK van output of 47,344 units in 2025 became a small, electric-focused base against a registered market of 315,422 vans.
Strategic Implications
- For manufacturers, large vans are the volume core and the electric proposition has to win there. Vans of more than 2.5 to 3.5 tonnes carry 69.92% of value and most electric growth, so range, payload and depot charging fit matter more than a pickup or small-van launch, and a mandate that is under review argues for keeping diesel and electric versions on one platform.
- For fleet operators and lessors, the cost of delay is rising. With the Plug-in Van Grant confirmed to at least 2027 and rates for 2026 to 2027 to be set, electric vans bought now on depot charging carry a smaller price premium than public-charging-dependent routes, and operators can order electric vans for urban rounds while keeping diesel for long-haul work.
- For pickup makers, the Ranger and Hilux range has to be sold on a different basis. With most double-cab pickups taxed as cars, the buyer is the sole trader or business that values payload and work use, not the company-car driver, and a commercial 4x4 such as the Defender or a one-tonne payload specification keeps van treatment.
- For charging and energy suppliers, depot charging is the investable segment. Marqstats estimates battery-electric vans at 100,000 units by 2030, about 3.6 times the 27,789 of 2025, and each needs depot charging and a grid connection; suppliers of smart charging and fleet energy management gain more than public rapid charging networks.
- For body builders and converters, electric chassis cabs are the constraint. About 50,000 vans a year are converted into tippers, Lutons and refrigerated vans, so converters who can fit bodies to electric chassis and complete multi-stage type approval gain share as the mandate tightens.
Market Segmentation
Small vans of up to 2.0 tonnes account for 1.60% of 2025 value, USD 225.64 million, and shrink at 3.92% a year to USD 184.72 million. Registrations were 8,766 in 2025, up 1.9%, but fell 19.82% in January to September 2026 as buyers moved to larger, more capable vans, and Marqstats expects 6,500 by 2030.
Medium vans of more than 2.0 to 2.5 tonnes account for 12.09% of 2025 value, USD 1,704.09 million, and grow at 4.91% a year to USD 2,165.52 million. Marqstats places car-derived vans such as the Peugeot Partner (9,450 vans in 2025) and the Citroën Berlingo (9,487) in this class, which fell 20.7% to 51,639 in 2025 and recovered 4.81% in January to September 2026, and Marqstats expects 58,000 by 2030.
Large vans of more than 2.5 to 3.5 tonnes account for 69.92% of 2025 value, USD 9,852.87 million, and grow at 6.84% a year to USD 13,718.54 million and 75.14% of the market. Registrations were 210,262 in 2025, down 9.8%, and rose 14.04% in January to September 2026; the Ford Transit Custom (49,774), Ford Transit (30,353), Mercedes-Benz Sprinter (13,605), Vauxhall Vivaro (12,315), Renault Trafic (11,703), Volkswagen Transporter (10,827) and Volkswagen Crafter (9,778) lead.
Pickups account for 12.76% of 2025 value, USD 1,797.50 million, and fall 7.51% a year to USD 1,216.90 million. The Ford Ranger registered 17,462 vehicles in 2025, but the tax change of April 2025 cut January to September 2026 registrations by 55.48%, and Marqstats expects the segment to settle near 22,000 vans a year.
Commercial 4x4s account for 3.63% of 2025 value, USD 511.16 million, and grow fastest, at 13.69% a year, to USD 970.75 million. Registrations were 7,447 in 2025, and rose 67.67% in January to September 2026 as the Land Rover Defender and similar utility vehicles kept van tax treatment, taking 22.67% of the volume that pickups lost.
Diesel vans account for 83.56% of 2025 value, USD 11,775.29 million, and fall 1.34% a year to USD 11,008.56 million and 60.30% of the market. Diesel registrations were 269,301 in 2025, 85.38% of the in-scope market and 84.7% of the SMMT fuel table, and Marqstats expects 222,000 by 2030 as the mandate pushes volume to electric vans.
Battery-electric vans account for 10.58% of 2025 value, USD 1,490.20 million, and grow fastest, at 30.40% a year, to USD 5,618.81 million and 30.78% of the market. Units rise from 27,789 to 100,000, and Marqstats values them at GBP 40,625 per van in 2025, a premium of GBP 7,500 over a diesel van.
Other powertrains, which include petrol, mild-hybrid, plug-in hybrid and fuel-cell vans, account for 5.86% of 2025 value, USD 825.77 million, and grow at 14.56% a year to USD 1,629.06 million. Registrations were 18,332 in 2025, up 70.3% on the SMMT basis, driven by plug-in hybrid pickups, and Marqstats expects 32,000 by 2030.
By Geography
England
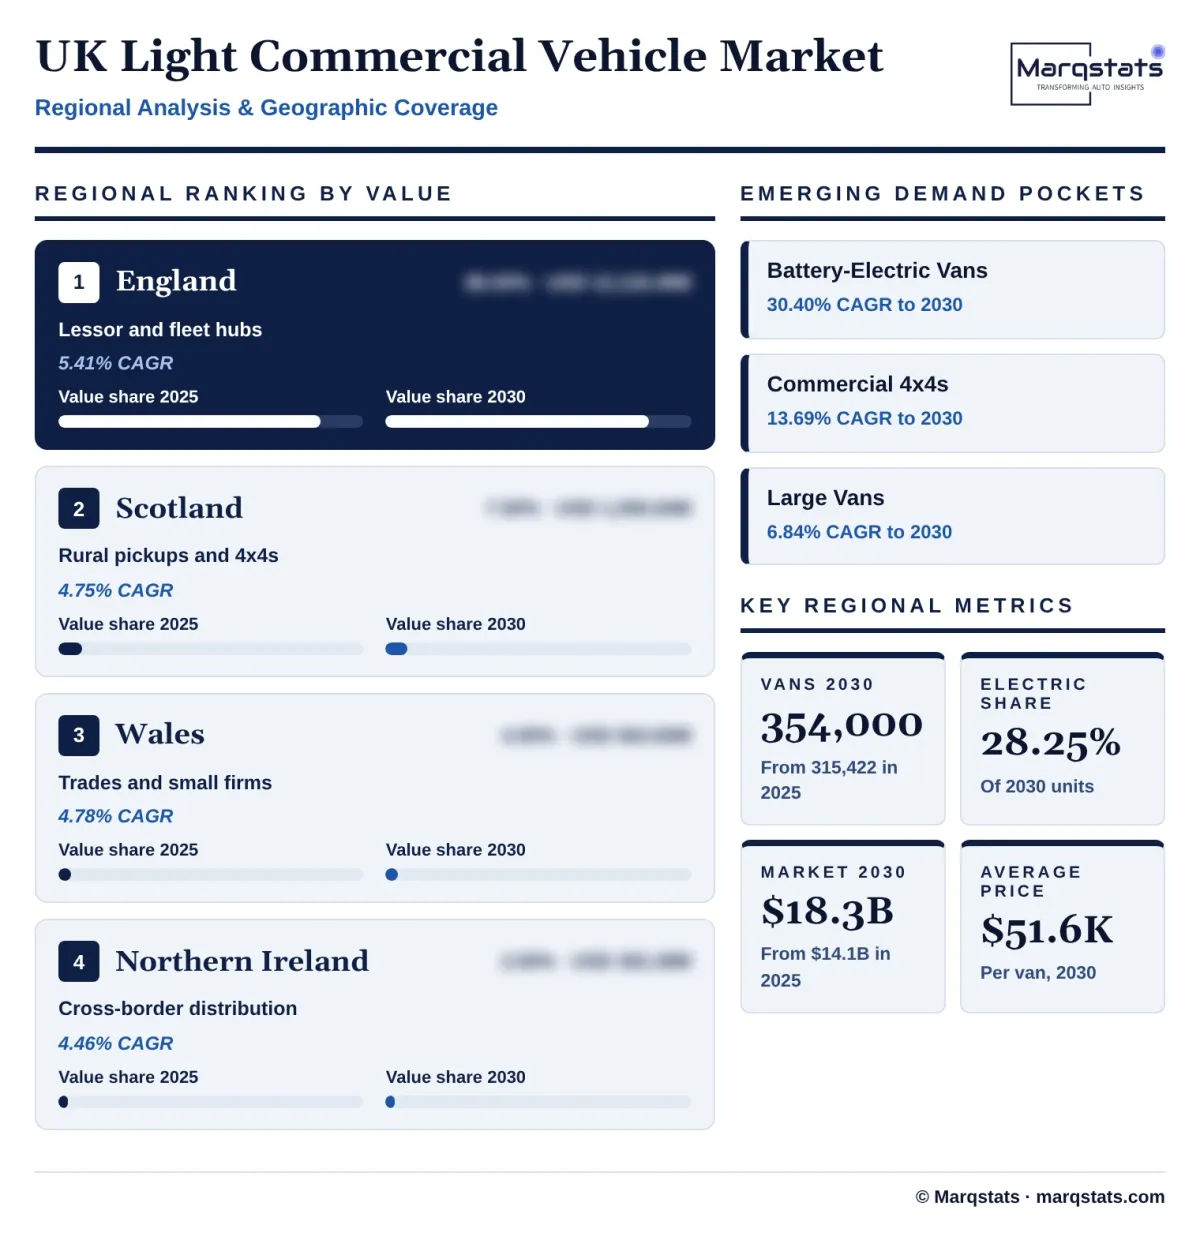
England accounts for 86.00% of 2025 value, USD 12,118.49 million, and grows at 5.41% a year to USD 15,773.56 million. The share overstates England usage because lessors, rental companies and national fleets register vans at head-office addresses, and Marqstats allocates value by registration, as SMMT and lenders do; the logistics belt from the Midlands to the South East and the depot clusters around major cities drive electric adoption.
Scotland
Scotland accounts for 7.50% of 2025 value, USD 1,056.84 million, and grows at 4.75% a year to USD 1,332.72 million. Rural and agricultural buyers favour pickups and 4x4s, the segments hit hardest by the tax change, which holds Scottish growth below the national rate.
Wales
Wales accounts for 4.00% of 2025 value, USD 563.65 million, and grows at 4.78% a year to USD 712.00 million. Independent trades and small businesses buy mainly diesel vans of 2.0 to 3.5 tonnes, so Welsh electrification depends mainly on the Plug-in Van Grant and on charging at small depots.
Northern Ireland
Northern Ireland accounts for 2.50% of 2025 value, USD 352.28 million, and grows at 4.46% a year to USD 438.15 million. Cross-border haulage and distribution keep demand for large panel vans steady, and the market is small enough that a single fleet order can move its share.
How Competition Is Evolving
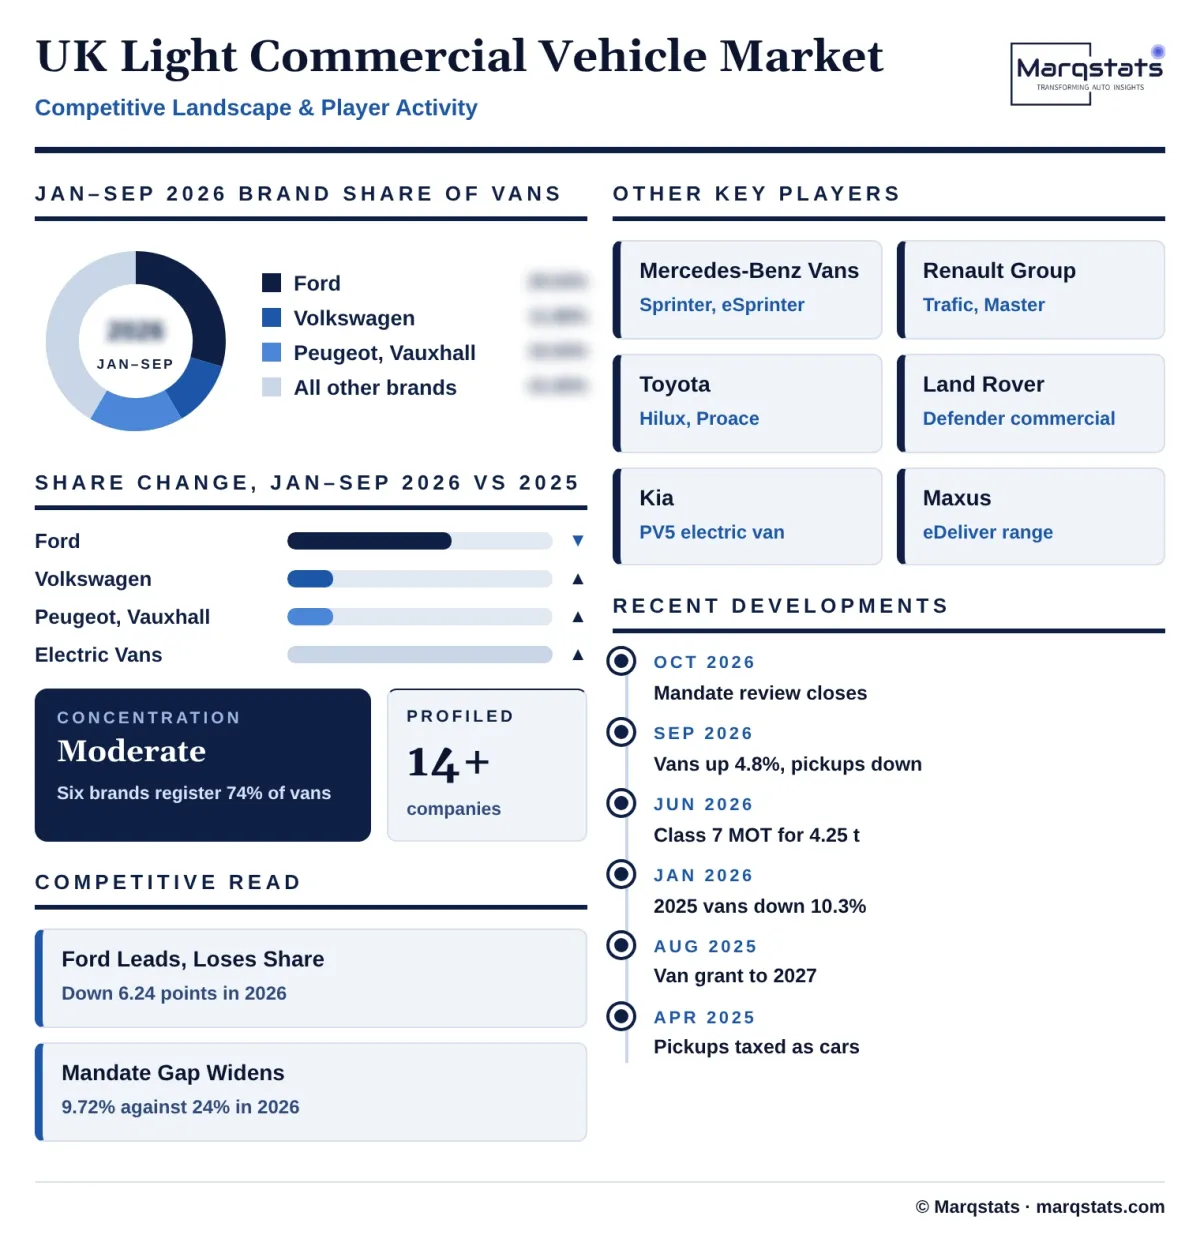
The market is led by one brand and contested by five others. Ford registered 35.77% of vans in January to September 2025 and 29.53% in the same months of 2026, while Volkswagen rose from 10.20% to 11.88%, and Peugeot and Vauxhall together moved from 15.24% to 16.94%. The three Ford nameplates, Transit Custom, Transit and Ranger, registered 97,589 vans in 2025, 30.94% of the market, and the Transit Custom alone 15.78%. Marqstats rates the market as moderately concentrated, because the six largest brands registered about 74% of vans in January to September 2026 but no brand exceeded 30%.
Ford is giving up share where it was strongest. The Ranger registered 17,462 vehicles in 2025 and only about 6,856 in January to September 2026 as the pickup tax change hit its buyers, and Ford share of registrations dropped by 6.24 percentage points between the two nine-month periods. Volkswagen gained with the Transporter and Crafter, Mercedes-Benz with the Sprinter and eSprinter, and Renault with the Trafic and Master.
Stellantis and the Chinese-owned challengers compete on electric versions. The group builds the Vauxhall Vivaro, Peugeot Expert and Citroën Dispatch family at Ellesmere Port, and while Kia launched the PV5 purpose-built electric van and Maxus, owned by SAIC Motor, sells the eDeliver range. Toyota sells the Hilux and the Proace, and Isuzu the D-Max pickup.
Competition is moving from price to supply and charging solutions. Manufacturers that can deliver electric vans at a price within the Plug-in Van Grant, with depot charging partners and finance packages from lessors, are winning fleet frameworks, and Marqstats expects the electric segment to hold the largest share gains to 2030, as the mandate review is concluded.
Companies Covered
Companies covered in the report include:
Recent Market Activity
Table of Contents
Coverage & Segmentation
The study covers the UK light commercial vehicle market, with 2025 as the base year, 2021 – 2025 as the historical period and 2026 – 2030 as the forecast period. It covers new vehicles of up to 3.5 tonnes gross vehicle weight (category N1) registered for the first time in England, Scotland, Wales and Northern Ireland, segmented by vehicle size and type and by powertrain, with value counted as the net transaction price before VAT and before body conversion, converted at the 2025 average of GBP 1 = USD 1.32.
Electric rigids of 3.5 to 4.25 tonnes (2,380 in 2025), heavier trucks, passenger cars, used vans, aftermarket parts and body conversion upfit value are excluded. Segment and regional splits are Marqstats estimates built on SMMT registrations and price benchmarks. The live Marqstats reports on the Europe electric light commercial vehicle market and the Europe light commercial vehicle body conversion market are broader and overlap in part, so their figures should not be added to this market; the SMMT electric figure of 30,169 is 27,789 on the in-scope basis used here.