Market Snapshot
Key Takeaways
Market Overview & Analysis
Report Summary
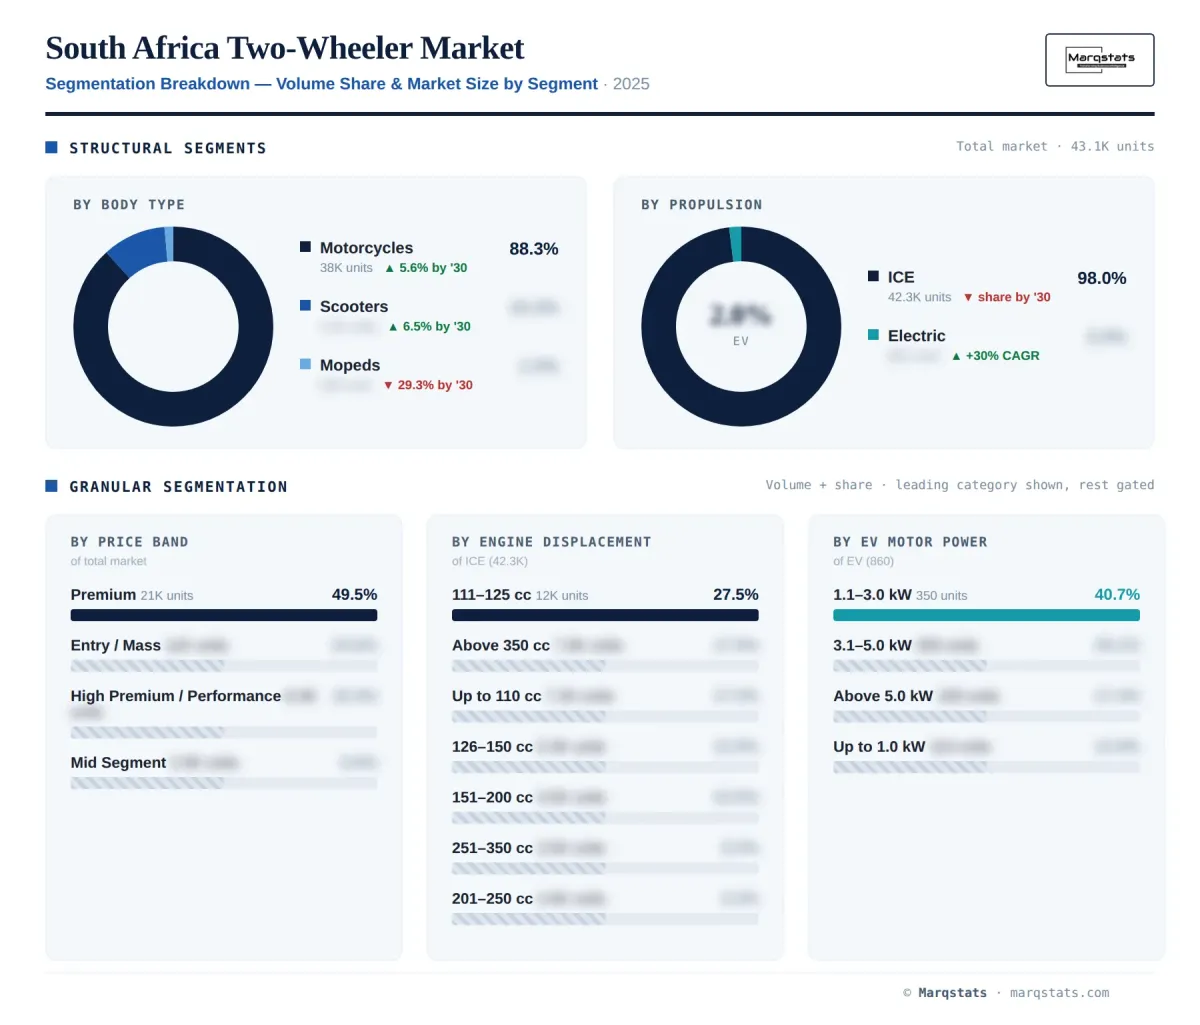
The South Africa two-wheeler market covers motorcycles, scooters, and mopeds sold for private, commercial, and institutional use. The study measures demand in unit volumes and revenue across 2021 to 2025 historical years and 2026 to 2030 forecast years, with 2025 as the base year. Coverage spans propulsion type, engine displacement and motor power, price band, end user, sales channel, and brand.
South Africa differs from most regional markets in its dual structure. A commuter and delivery layer uses small, affordable motorcycles and scooters, while a well-established leisure segment supports premium touring, cruiser, and performance machines. Average selling prices sit above budget markets and below pure-premium markets, and both layers contribute to growth. The result is a market with broad brand participation across value and premium tiers.
Import dependence shapes supply and pricing. South Africa assembles few two-wheelers, so most units arrive from Asia, Europe, and other regions. Import duties and value-added tax raise landed cost, and electric models face higher duties than combustion machines, which slows their adoption outside commercial use. Currency movements also influence prices and the timing of demand.
Growth is attributed to rapid-delivery and e-commerce expansion, urbanization, and traffic congestion in major cities. South Africa sits within the broader Africa two-wheeler market, however it carries a larger premium and recreational segment than most of the continent. Revenue grows faster than units owing to the premium segment, and electrification adds a second growth axis from a small, commercially driven base.
Market Dynamics
Key Drivers
- Rapid-grocery and e-commerce delivery platforms scaled motorcycle and scooter fleets, which drove most recent market growth.
- Urbanization and traffic congestion in Johannesburg and Cape Town raise demand for congestion-resilient two-wheelers.
- An established leisure and touring culture sustains demand for premium and performance motorcycles.
- Faster delivery times than vans in dense urban areas, often two to three times quicker, support commercial fleet adoption.
- Rising fuel and vehicle costs improve the appeal of two-wheelers for commuting and work, especially among gig-economy and delivery riders seeking low-cost income opportunities.
Key Restraints
- Constrained disposable income limits leisure-segment growth during tough trading conditions.
- Higher import duties on electric models keep them less price-competitive than combustion machines.
- Safety concerns and road conditions constrain private commuter adoption in some areas.
- Currency movements raise the cost of imported models and components, which affects both entry-level affordability and premium pricing across the market.
Key Trends
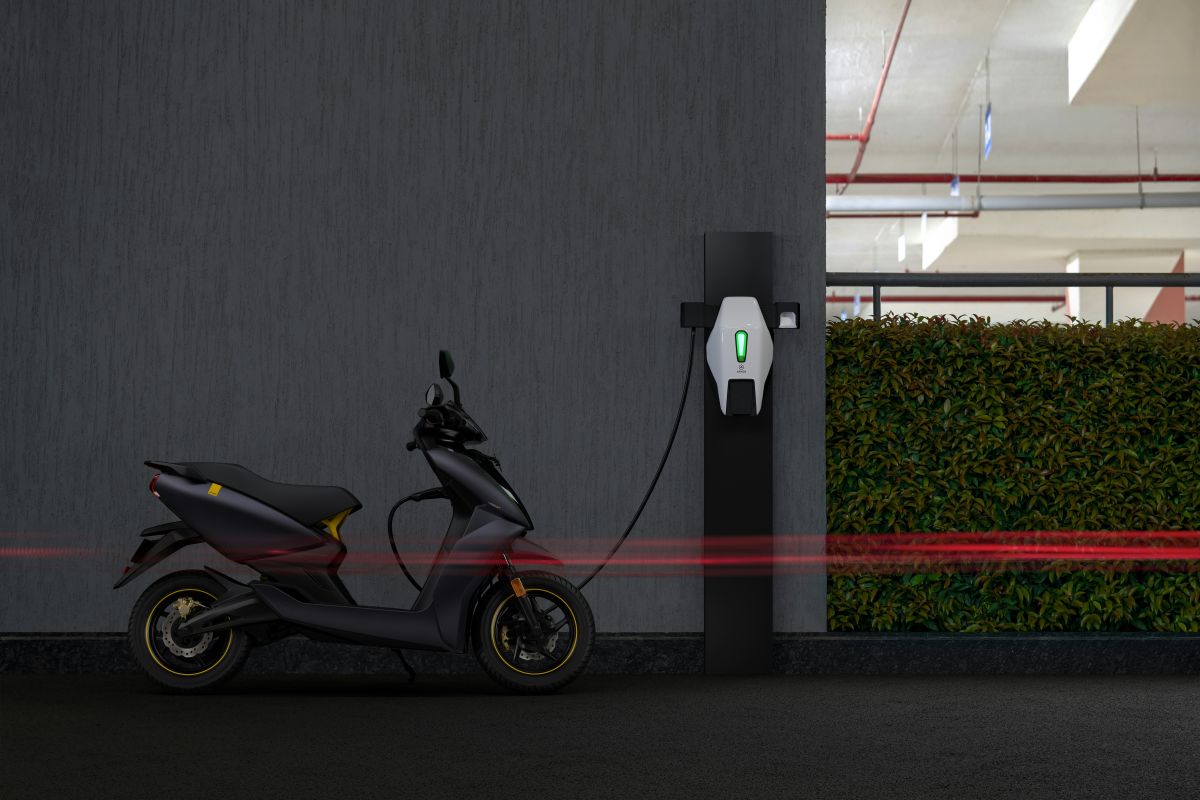
- Electric two-wheelers grow rapidly from a small base, almost entirely in commercial delivery use.
- Online retail scales quickly and is projected to overtake dealerships before 2030.
- Small commercial motorcycles and scooters gain share, owing to delivery demand.
- Premium and recreational demand grows steadily, led by touring and cruiser models.
Market Segmentation
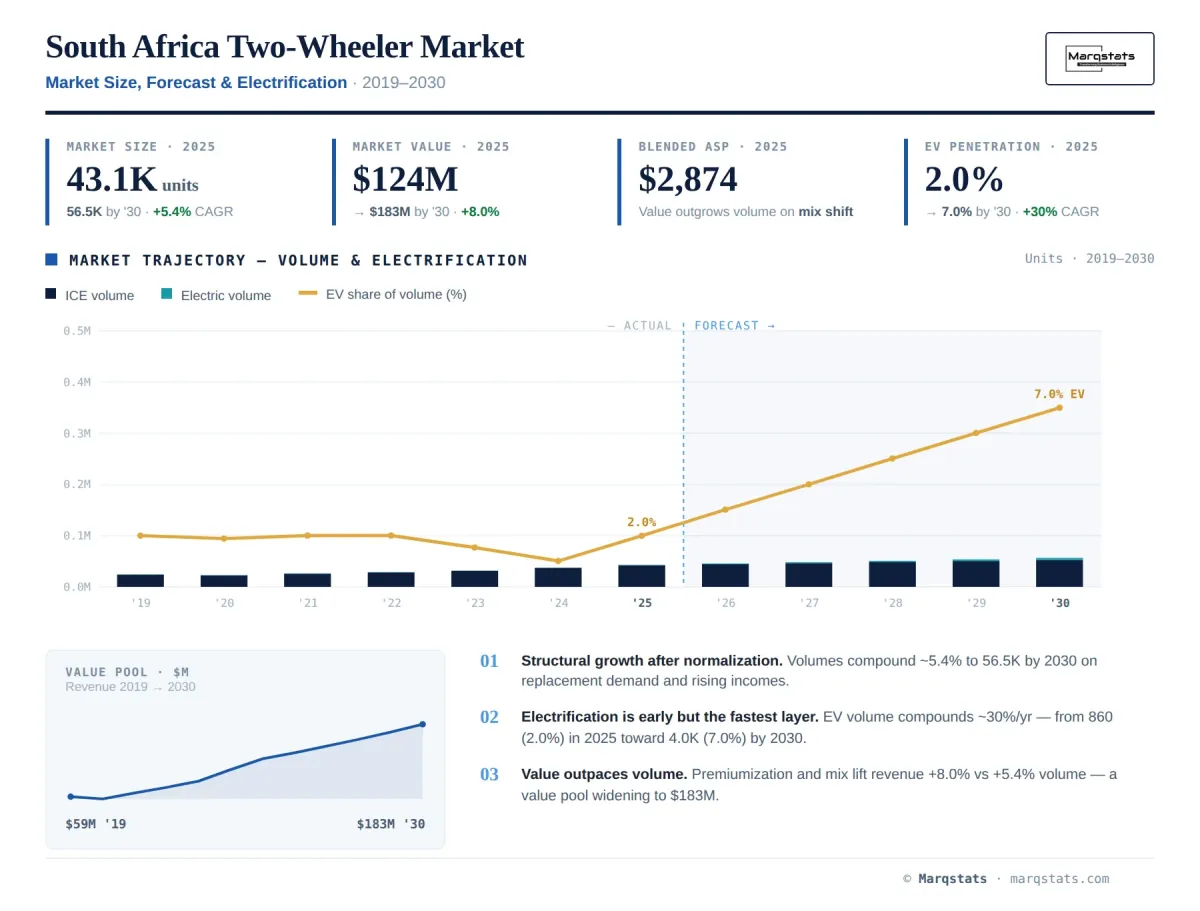
Motorcycles dominate, at about 88% of unit sales in 2025. Volumes reach 38.08 thousand units in 2025 and are projected to reach 50.14 thousand units by 2030, a 5.57% CAGR. Small commuter and delivery models drive volume, while premium touring, cruiser, and performance machines drive revenue.
Within motorcycles, small commuter models in the 110 to 150 cc range carry delivery and commuter volume, while large-displacement touring and cruiser models anchor the premium segment. This split gives the motorcycle category both the highest volume and the highest revenue in the market.
Scooters form the second category, at about 10% of units in 2025. Volumes rise from 4.43 thousand units in 2025 to 6.19 thousand units by 2030, a 6.45% CAGR. Delivery riders and urban commuters favor scooters for ease of use, and electric scooters add incremental demand.
Scooter demand benefits from the delivery economy and from first-time and women riders drawn to automatic transmission and easier handling. The category grows faster than motorcycles in percentage terms and is a focus for electric models in commercial fleets.
Mopeds are a small and declining category. Volumes fall from 0.63 thousand units in 2025 to 0.14 thousand units by 2030, a negative 29% CAGR. Buyers migrate toward more capable motorcycles and scooters, which steadily erodes moped demand across the forecast period.
The moped tier holds little relevance in South Africa, where commuter demand favors small motorcycles and scooters with greater range and utility. Its decline has minimal effect on the overall market, which is driven by the motorcycle and scooter categories.
Combustion models held about 98% of units in 2025. Volumes move from 42.28 thousand units in 2025 to 52.51 thousand units by 2030, a 4.3% CAGR. Combustion remains the base of the market through the forecast period, owing to touring range, refueling convenience, and higher import duties on electric models.
Electric two-wheelers are the fastest-growing propulsion type from a small base. Volumes rise from 0.86 thousand units in 2025 to 3.95 thousand units by 2030, a 30.07% CAGR, and revenue expands at a 31.36% CAGR. Growth is almost entirely commercial, led by delivery fleets. Electric share of units is projected to reach about 7% by 2030, however higher import duties constrain faster adoption.
Delivery operators are the primary electric adopters, owing to daily mileage that rewards lower running costs. Fleet procurement drives most electric demand, and private leisure adoption remains limited. As local support and model availability widen, electric volumes scale quickly from a low base, concentrated in commercial use.
Small-displacement models anchor the commuter and delivery layer. Combined volumes for engines up to 150 cc account for about 57% of combustion units, with the 111 to 125 cc band the single largest at 11.63 thousand units in 2025. Delivery and commuter demand sustains this base.
Mid-capacity motorcycles serve commuting, learning riders, and lighter leisure use. The 251 to 350 cc band reached 3.5 thousand units in 2025. This range grows steadily, owing to rising interest from newer riders.
The mid band bridges the commuter and leisure segments. Newer riders often begin here before moving to larger machines, and the range also serves lighter touring and commuting needs across the major cities.
Large-displacement machines form a notable premium layer, at 7.58 thousand units in 2025, close to 18% of combustion units. Touring, cruiser, and performance models anchor this band, and it generates a large share of market revenue. This premium presence is larger than in most regional markets.
The premium segment reflects South Africa’s established recreational riding culture. Scenic routes, touring clubs, and a mature dealership network support demand for large-displacement machines. This segment is a defining feature of the market and a major contributor to revenue despite modest unit share.
Within electric two-wheelers, higher-power bands grow fastest, with the above 5.0 kW class expanding at a 38% volume CAGR. Most electric demand serves commercial delivery in the 1.1 to 3.0 kW range.
The entry and mid tiers serve commuter and delivery demand and grow fastest through the forecast period, owing to rapid-delivery fleet expansion. Value brands hold strong positions in these tiers, and small commercial motorcycles anchor volume.
The premium and performance tiers serve the leisure and touring segment, and they generate a large share of revenue. The price-band classification was revised during the historical period, so tier shares are stated on a reconciled basis. Premium demand grows in line with the leisure segment, led by touring and cruiser brands.
The value and premium tiers therefore serve different buyers and support different brands. Delivery and commuter demand concentrates in the lower tiers, while leisure and touring demand supports the upper tiers. This balance keeps the market resilient across economic cycles, as commercial demand offsets softer discretionary spending.
Private consumers are the dominant end user, at roughly 90% of demand with 39.05 thousand units in 2025. This base includes owner-operators who use motorcycles for delivery work. It grows at a 5% CAGR through the forecast period, supported by both commuting and delivery ownership.
Private ownership spans commuters, leisure riders, and delivery owner-operators, which blurs the line between private and commercial use. Replacement demand grows as commercial riders cover high daily mileage and renew machines on shorter cycles.
Commercial and fleet demand grows faster than private demand. Delivery and logistics is the largest commercial use at 2.87 thousand units, growing at an 8% CAGR, and ride-hail, rental, and tourism use expands at an 11% CAGR. Rapid-grocery and e-commerce fleets drive much of this growth, and electric models concentrate here, owing to predictable urban routes that reward lower running costs and shorter payback periods.
Online retail is scaling rapidly, at close to 33% of units in 2025 with 14.27 thousand units. Volumes rise to 30.22 thousand units by 2030, a 15.16% CAGR, and revenue grows at an 18.18% CAGR. Online sales are projected to overtake offline volumes before 2030, owing to established digital marketplaces and delivery-fleet procurement.
Dealerships and physical retailers held about 67% of units in 2025 with 28.88 thousand units. However, offline volumes decline at a negative 2.09% CAGR as buyers shift online. Physical dealers retain value for premium sales, service, and brand experience.
Online growth reflects both consumer buying habits and fleet procurement by delivery operators. Digital marketplaces provide listings, financing, and remote transactions, which lowers friction for buyers. Physical dealerships remain important for premium launches, test rides, and after-sales service, however their share of unit volume declines steadily through the forecast period.
By Geography
Gauteng
Gauteng, including Johannesburg and Pretoria, is the largest demand center, at close to 40% of national demand. Economic and population data from the national statistics agency (statssa.gov.za) records the largest urban base and delivery activity here. Commuting, courier fleets, and premium demand all concentrate in the province, which makes it the reference market for new-model launches, fleet procurement, and electric two-wheelers.
Western Cape
The Western Cape, led by Cape Town, combines commuting and delivery demand with a strong leisure and touring culture. Scenic riding routes support premium and recreational demand, and tourism adds rental use. The province is a core market for the premium segment.
Cape Town and surrounding areas host a strong touring and recreational community, and the region attracts riders for scenic coastal and mountain routes. Delivery demand in the metropolitan core adds a growing commuter layer alongside the leisure base.
KwaZulu-Natal
KwaZulu-Natal, led by Durban, adds coastal commuting, delivery, and warm-climate riding. Delivery fleets and commuter demand sustain volumes, and the region supports both value and mid-capacity models.
Durban’s warm climate supports year-round riding, and the port and logistics economy sustains delivery and commercial demand. The region combines commuter volume with a growing leisure interest along the coast.
Other Provinces
Other provinces, including the Eastern Cape and Free State, add demand around secondary cities and rural districts. Motorcycles support commuting, agriculture, and small business, and durable, low-cost models are most common here.
Across these provinces, motorcycles function as practical transport and work tools rather than leisure vehicles. Distances between towns and limited public transport reinforce demand, and a large used market supports affordability and lengthens the effective life of each machine.
How Competition Is Evolving
The South Africa two-wheeler market is moderately fragmented, with a broad field of value and premium brands. A Japanese brand led unit volume with about 18% of units in 2025, ahead of a premium European brand at about 14%. The five largest brands held close to 58% of volume. Premium brands hold an outsized share of revenue, owing to high average prices.
Competition reflects the dual market. Value brands compete on price, durability, and delivery-fleet supply in the commuter tier. Premium brands compete on heritage, touring capability, performance, and dealership experience in the leisure tier. A Japanese brand leads unit volume across both commuter and mid-capacity segments, while a premium European brand leads revenue.
Distribution strategy is a growing point of difference, and brands that build online sales and fleet-procurement channels gain share as delivery demand and e-commerce scale. Service network depth and parts availability remain decisive for premium sales. Electric entrants concentrate on commercial delivery, where duty cycles reward lower running costs.
Brand strategy also reflects the shift toward online distribution and fleet procurement. Premium marques defend share through heritage, dealership experience, and touring support, while value brands scale delivery-fleet supply and dealer coverage. Brands that serve both the commuter and premium layers gain resilience across economic cycles.
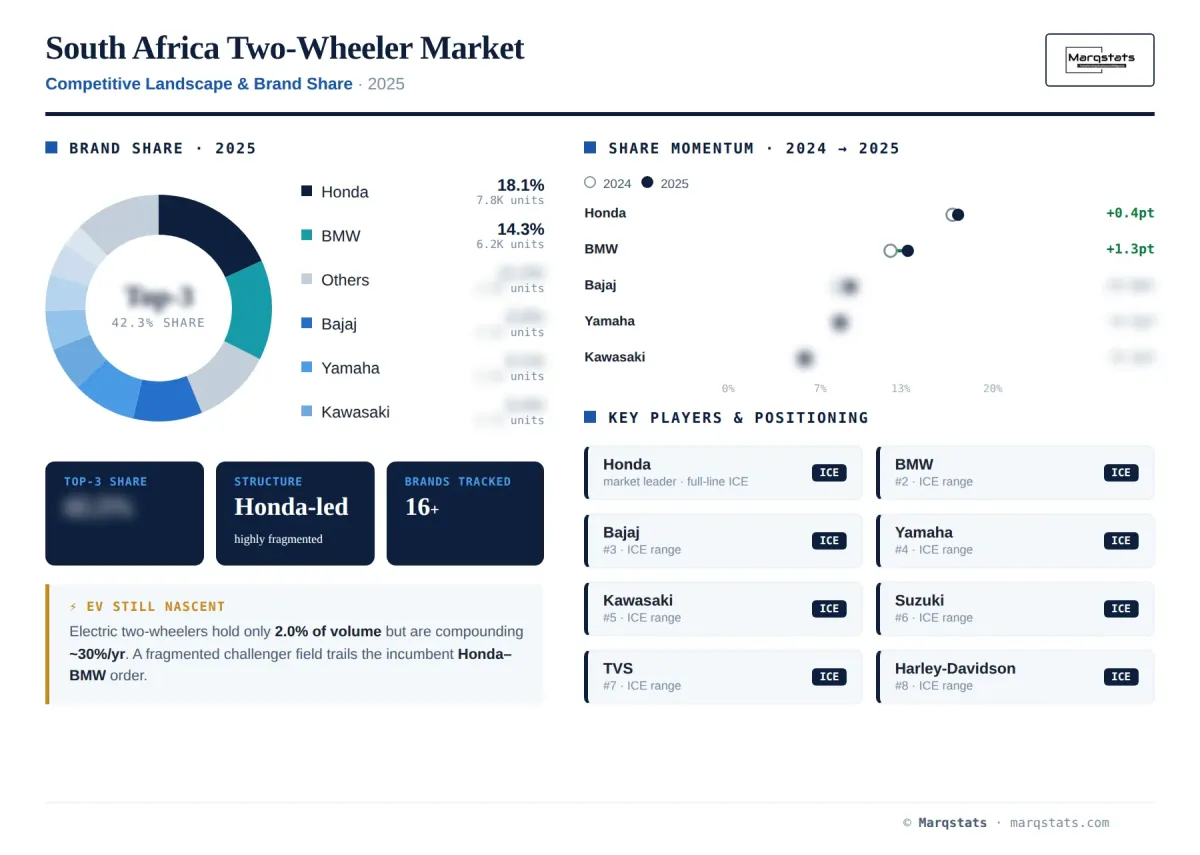
Companies Covered
The report profiles 16+ companies with full strategy and financials analysis, including:
Recent Market Activity
Table of Contents
Coverage & Segmentation
This report provides a comprehensive analysis of the South Africa two-wheeler market across 2021 to 2030, with 2025 as the base year and 2026 to 2030 as the forecast period. The study measures market size in unit volumes and revenue, and it segments demand by vehicle type, propulsion type, engine displacement and motor power, price band, end user, sales channel, and brand.
The report examines demand drivers, restraints, and trends, along with competitive structure and brand positioning. Regional coverage spans Gauteng, the Western Cape, KwaZulu-Natal, and other provinces. The analysis integrates registration data, industry association figures, and primary interviews to reconcile brand-level and category-level estimates into a single market view. The price-band series reflects a reclassification during the historical period and is stated on a reconciled basis.
The study also assesses the dual market structure, delivery-driven growth, early electrification, and the balance between private and commercial demand. Forecasts are built at the segment level and reconciled to the total market, so that vehicle type, propulsion, displacement, price band, end user, and channel views remain internally consistent across the historical and forecast periods.