Market Snapshot
The India EV charging dynamic load management market size is estimated at USD 22.45 million in 2025 and is projected to reach USD 88.83 million by 2030, growing at a CAGR of 31.66% over 2026 – 2030. New sites fitted with dynamic load management rise from about 3,300 in 2025 to 15,650 in 2030, and the installed base of managed sites grows from about 8,500 to 54,560, which turns recurring software licences into the fastest-growing component.
Marqstats defines the market as the value of the site-level layer that measures and shares power across EV chargers behind a utility meter: edge controllers, gateways and power-sharing panels, current transformer (CT) and sub-metering units used for load control, DLM software licences sold per site, and the integration and commissioning work that makes them run. Value is counted at the supplier invoice in US dollars, before goods and services tax. Charger hardware, including chargers with built-in power sharing, charge station management system (CSMS) smart-charging modules, payment and roaming platforms, transformers, battery storage and civil works are excluded.
Fleet depots account for 49.00% of 2025 value, edge controllers and power-sharing panels for 44.73% and high-tension connected sites for 53.72%. Southern India, led by Karnataka with 6,096 public charging stations, accounts for 38.00% of value, while residential multi-dwelling buildings grow fastest, at 39.00% a year.
Key Takeaways
Market Overview & Analysis
Report Summary
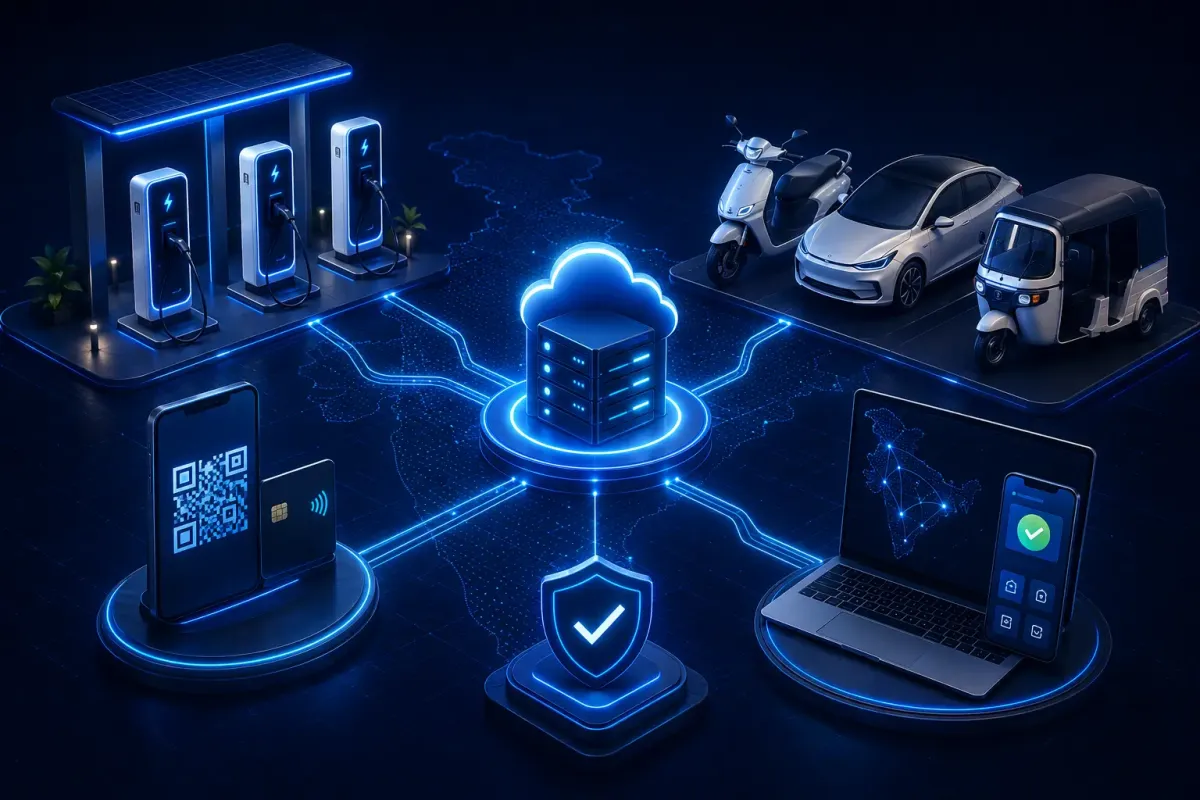
Marqstats sizes the India EV charging dynamic load management market as spending on the equipment, software licences and engineering that let a site run more chargers than its grid connection could serve if every charger drew full power at once. A DLM system reads the total load at the site incomer through CT clamps or a sub-meter, compares it with the sanctioned load, and tells each charger how much current it may draw, many times a minute. It covers fleet depots, public charging plazas, residential multi-dwelling buildings and commercial and workplace sites.
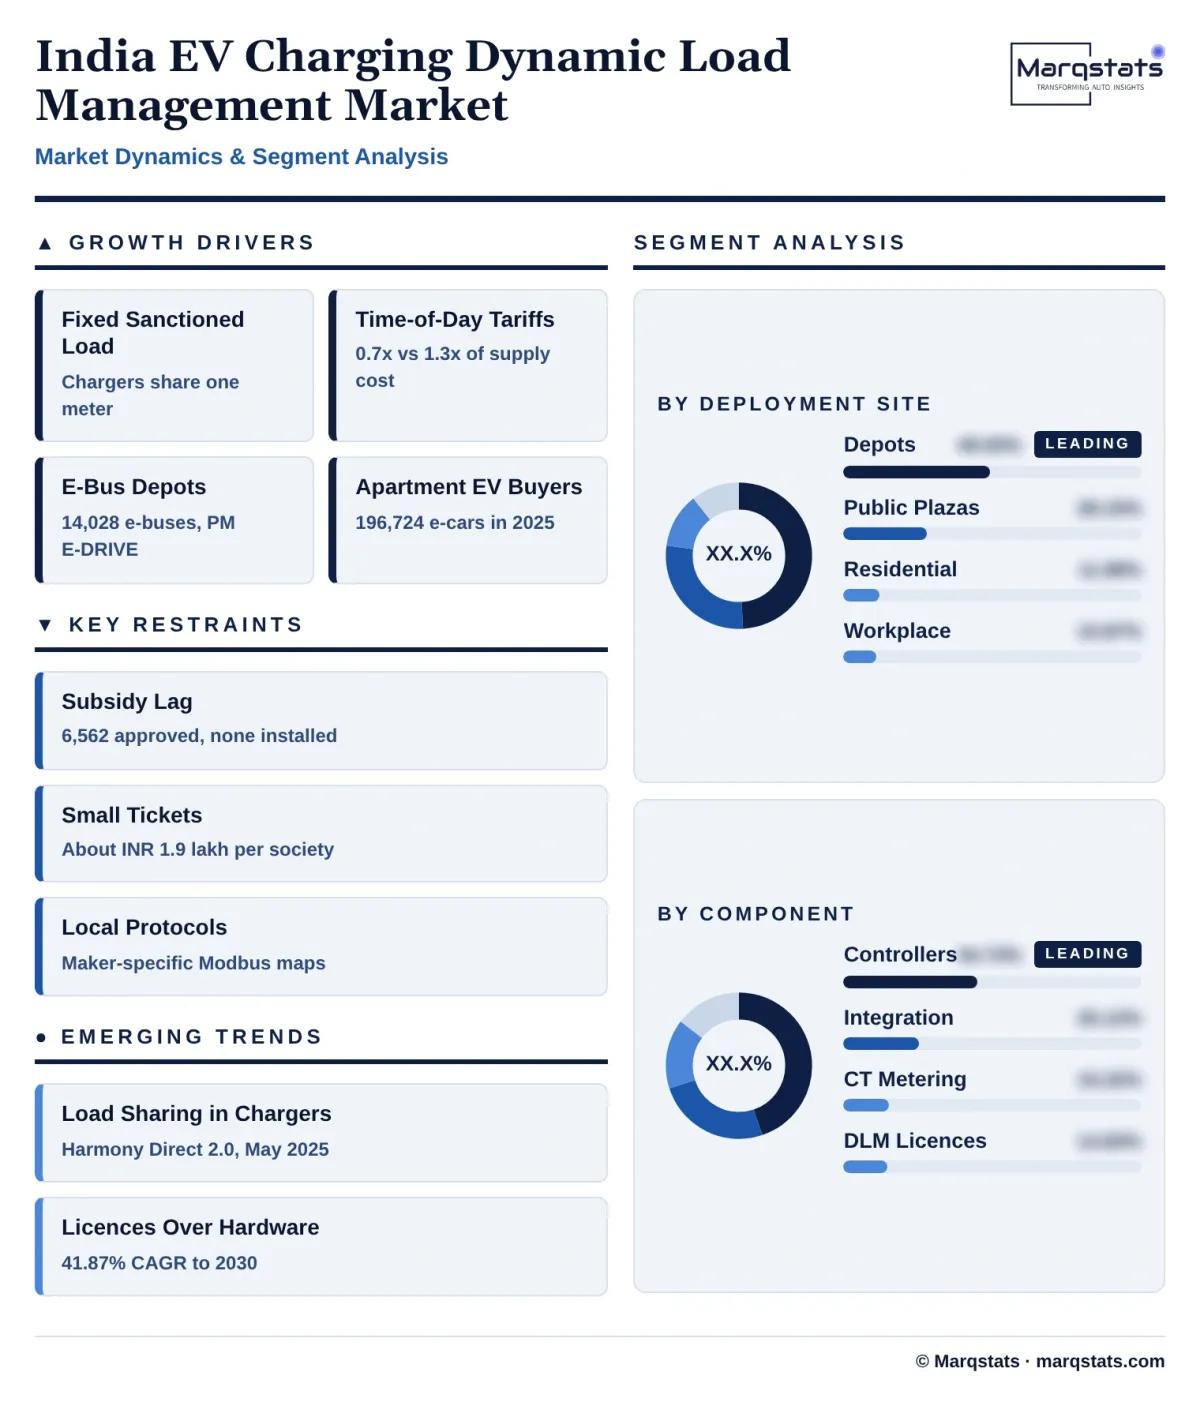
Grid connection is the bottleneck. The Ministry of Power issued the Guidelines for Installation and Operation of Electric Vehicle Charging Infrastructure, 2024 in September 2024. They require separate metering for each charging station, let distribution companies provide sub-metering behind the meter of an existing high-tension connection, cap the tariff for charging stations at the average cost of supply, and set time-of-day tariffs of 0.7 times the average cost of supply in solar hours and 1.3 times in non-solar hours. A site that charges behind an existing meter keeps its old sanctioned load, so it either upgrades the connection or manages the load.
The charging base is growing quickly but unevenly. The Ministry of Heavy Industries counted 5,151 public charging stations in December 2022, 11,903 in December 2023 and 25,202 in December 2024, and told Parliament in December 2025 that 29,151 public stations had been installed over five years, including 8,805 fast-charging stations. Karnataka had 6,096 stations, Maharashtra 4,166, Uttar Pradesh 2,316, Delhi 1,957 and Tamil Nadu about 1,780, so five states hold 55.97% of the national network.
Vehicle demand supports private charging. EV sales passed 2.36 million units in calendar 2025, 8.36% of all vehicle sales, with 1,345,244 electric two-wheelers and 196,724 electric passenger cars, up 85.1% from 2024. Electric bus fleets grew to about 16,300 operating buses by March 2026, according to the live Marqstats depot software report, and each depot holds tens of chargers on one connection, which is where DLM pays back first.
The market grew from an estimated USD 2.95 million in 2021, when about 420 sites were fitted with load management, to USD 5.60 million in 2022, USD 9.70 million in 2023 and USD 15.80 million in 2024. It rose 42.09% to USD 22.45 million in 2025, equal to about INR 195.31 crore at the 2025 average rate of INR 87.00 per US dollar, as e-bus depots, housing societies and workplace hubs added managed sites.
India EV Charging Dynamic Load Management Market Size and Forecast
The India EV charging DLM market grows from USD 22.45 million in 2025 to USD 88.83 million in 2030, a CAGR of 31.66%. Annual growth eases from 32.83% in 2026 to 30.75% in 2030 as the base widens. New managed sites rise from about 3,300 to 15,650 a year, a 36.52% annual rate, while the installed base of sites paying for DLM licences grows from about 8,500 to 54,560.
The 2025 value is built bottom-up from sites and tickets. Marqstats estimates about 520 fleet depots and logistics hubs fitted with DLM in 2025 at about INR 16.0 lakh each for controllers, metering and integration, 1,250 public charging plazas and forecourts at INR 3.6 lakh, 1,050 residential buildings at INR 1.9 lakh and 480 commercial and workplace sites at INR 3.8 lakh. Annual software licences of INR 1.30 lakh, 0.36 lakh, 0.16 lakh and 0.32 lakh per active site are applied to the average installed base. The average value per new site is about USD 6,803 including licences.
The base is checked against the wider charging market. The live Marqstats India EV Charging Station report puts the full charging market at about USD 487 million in 2025, so the DLM layer equals 4.61% of it. The live India Commercial EV Fleet Depot Energy Management Software report sizes depot software at about USD 24 million in 2025, with depot energy and load management as its largest type; the fleet-depot DLM licences sized here, about USD 1.43 million, sit inside that figure.
Prices fall while volumes rise. Marqstats expects the average upfront ticket to fall by about 15% to 2030 in every site type, as Indian makers such as Exicom Tele-Systems and Servotech build load sharing into standard panels, while licence revenue rises at 41.87% a year on a larger base. Upfront hardware and services still account for 78.45% of 2030 value.
Marqstats tracks four indicators to monitor the forecast: installation of the PM E-DRIVE public charging points already approved, state regulatory commission orders on time-of-day EV tariffs and sub-metering behind existing connections, electric bus depot commissioning under PM E-DRIVE and the PM e-Bus Sewa scheme, and housing society approvals for shared basement chargers in Bengaluru, Mumbai, Pune and the National Capital Region.
Market Dynamics
Key Drivers
Five forces are pushing site owners in India to manage charging load rather than buy more grid capacity.
- Sanctioned load is fixed while charger counts rise. A housing society, mall or depot that adds chargers behind its existing meter stays within the load it already pays for. A DLM controller lets ten or twenty chargers share that load instead of the owner applying for a higher connection, a new transformer and the inspection that comes with it.
- Time-of-day tariffs reward scheduled charging. The 2024 Ministry of Power guidelines set charging-station tariffs at 0.7 times the average cost of supply in solar hours and 1.3 times in non-solar hours, so every unit moved from the evening to the solar window costs 46.15% less. The Kerala State Electricity Regulatory Commission approved a solar-hour EV tariff 30% below the ruling tariff on 20 May 2025, and fleet operators use DLM software to follow those windows.
- Electric bus depots concentrate load. PM E-DRIVE targets 14,028 electric buses between April 2024 and March 2028, and depots that charge 50 to 100 buses overnight on one high-tension connection need software that sequences charging so the last bus is full before the first shift leaves.
- Electric car sales are moving into apartments. Electric passenger car sales rose 85.1% to 196,724 units in 2025, and most buyers in large cities live in multi-dwelling buildings whose basements were wired for lighting and lifts, not for many 7.4 kW chargers.
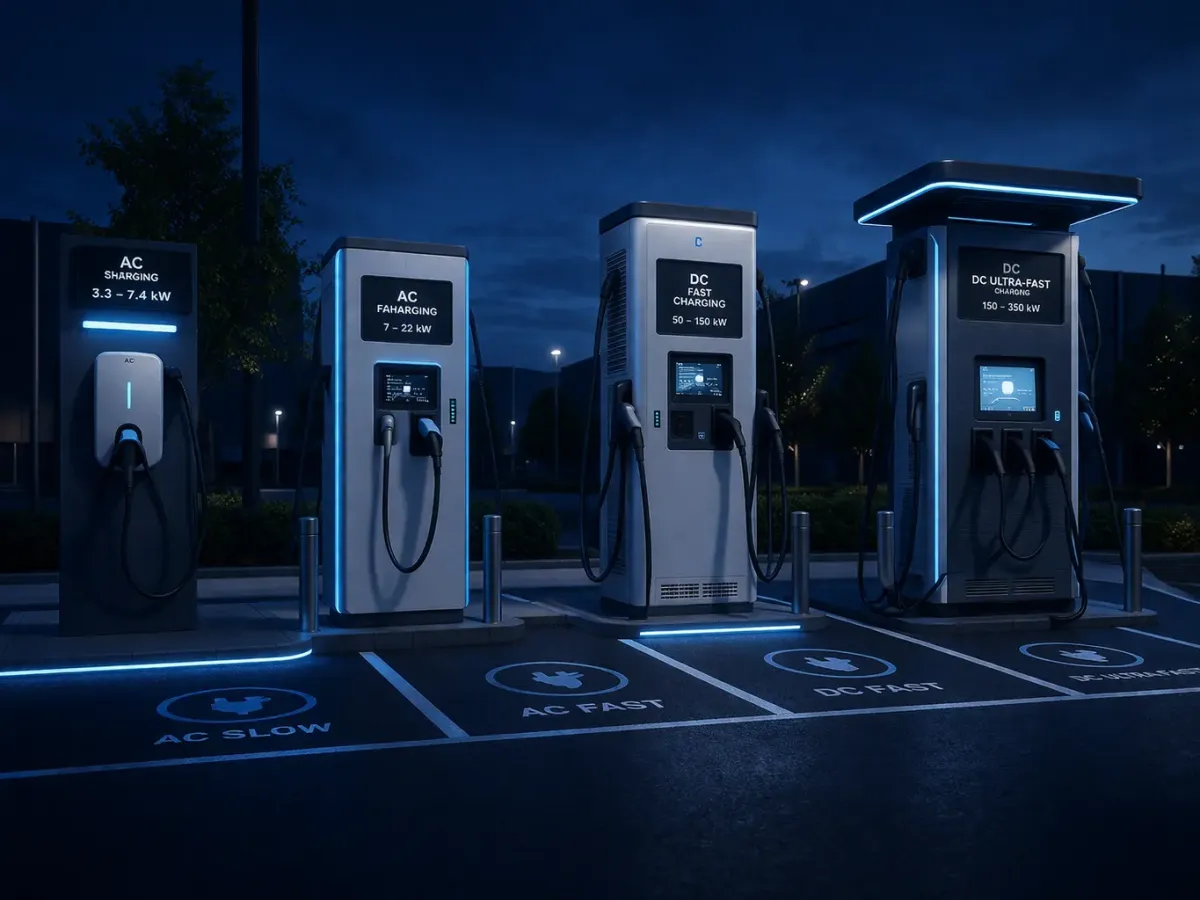
- Public plazas add guns faster than grid capacity. Network operators such as Tata Power, ChargeZone and Statiq place multi-gun DC chargers at highway and city hubs, and dynamic power sharing between guns lets one connection serve more vehicles at busy hours.
Key Restraints
Four constraints hold back adoption and keep average tickets small.
- Subsidised rollout lags approvals. The Ministry of Heavy Industries told the Lok Sabha that 6,562 public charging points approved under PM E-DRIVE had not been installed as of 22 July 2026, so public-plaza demand for DLM depends on a pipeline that has not started.
- Tickets are small and buyers are price-sensitive. A housing society spends about INR 1.9 lakh on a controller, metering and set-up, and many choose a static limit set at installation instead of a dynamic system, which keeps vendor margins thin.
- Local control protocols are not standard. Chargers talk to back-end software through the Open Charge Point Protocol, but local links between a site controller and chargers often use maker-specific Modbus register maps, so mixed-brand sites need gateways or custom integration.
- State tariff rules move at different speeds. Each state regulatory commission sets its own time-of-day windows and sub-metering rules, so a DLM schedule that saves money in Kerala may need different settings in Maharashtra or Delhi.
Key Trends
Four shifts are changing what a DLM system is, who sells it and where it sits.
- Load sharing moves into the charger. Exicom launched Harmony Direct 2.0 in May 2025 with dynamic load sharing between plugs and its Harmony Net technology for load management across chargers, which pushes standalone controllers toward larger and mixed-brand sites.
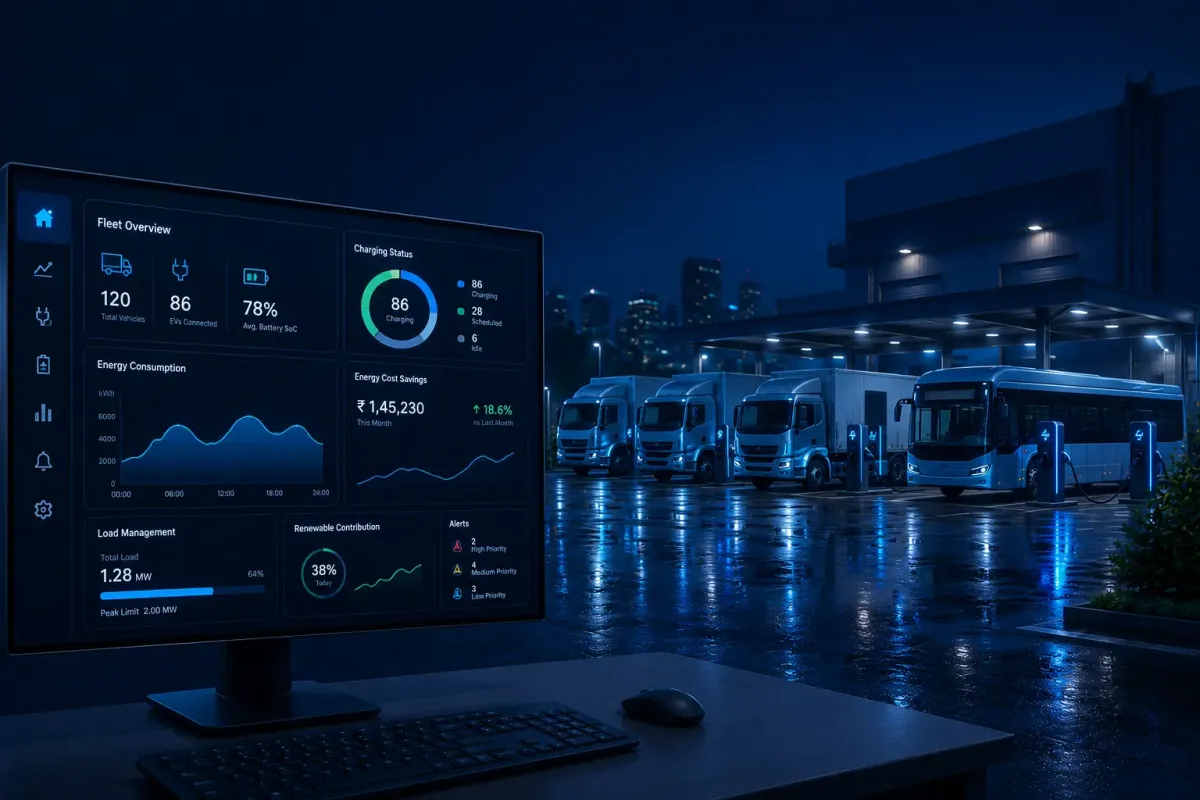
- Depot software adds energy management. Kazam launched an energy management system for e-bus hubs at Bharat Mobility Expo in January 2025, and depot buyers now ask for charge scheduling, tariff following and load limits in one tool.
- Licences replace one-off sales. Suppliers sell DLM as a yearly site licence with remote monitoring, so recurring revenue grows faster than hardware even as controller prices fall.
- High-tension sites add solar and storage. Large depots and workplaces pair rooftop solar and battery storage with DLM to charge more in solar hours and cap evening draw, which raises integration work per site.
Strategic Implications
- For DLM suppliers, the 2025 money is in private sites. Selling to bus depot operators, logistics firms and housing societies now, rather than waiting for subsidised public chargers to energise, captures the larger share of demand to 2028.
- For charger makers, built-in load sharing between guns is now expected. Makers that also offer an open site controller for mixed-brand chargers can sell into fleets and buildings that already have chargers from several suppliers.
- For charge point operators, DLM is the cheapest way to add guns at an existing site. Sharing power across guns and following time-of-day windows lets an operator raise throughput without waiting for a higher sanctioned load.
- For distribution companies, sub-metering behind existing connections with a certified load controller can defer transformer upgrades on feeders that serve dense apartment blocks and depots.
- For housing societies and builders, a controller installed with the first shared chargers avoids later rework when more residents buy electric cars.
Market Segmentation
Edge controllers, gateways and power-sharing panels account for 44.73% of 2025 value, USD 10.04 million, and grow at 30.86% a year to USD 38.52 million. They read site load and set charger limits locally, so control continues when the cellular link to the cloud drops, and they are the dominant component in every site type.
CT and sub-metering units account for 15.32% of 2025 value, USD 3.44 million, and grow at 28.32% a year to USD 11.97 million. Split-core CT clamps at the main incomer and sub-meters for EV loads behind an existing connection give the controller the reading it needs, and growth trails the market as meter prices fall.
DLM software licences account for 14.83% of 2025 value, USD 3.33 million, and grow fastest, at 41.87% a year, to USD 19.14 million and 21.55% of the market. They cover controller firmware licences and site load-management software billed per site. Smart-charging modules sold inside CSMS subscriptions are counted in the separate Marqstats smart EV charger study, not here.
Integration and commissioning services account for 25.12% of 2025 value, USD 5.64 million, and grow at 27.76% a year to USD 19.20 million. Load studies, panel wiring, phase balancing, testing with the distribution company and staff training are largest at depots and high-tension sites.
Fleet depots and logistics hubs account for 49.00% of 2025 value, USD 11.00 million, and grow at 30.90% a year to USD 42.28 million. Marqstats estimates about 520 depots and hubs fitted with DLM in 2025, mostly e-bus depots and hubs for electric three-wheelers, vans and ride-hailing cars, at about INR 16.0 lakh each.
Public charging plazas and fuel-station forecourts account for 28.15% of 2025 value, USD 6.32 million, and grow at 30.26% a year to USD 23.70 million. About 1,250 public sites added DLM in 2025, and growth after 2027 depends on the PM E-DRIVE points being installed.
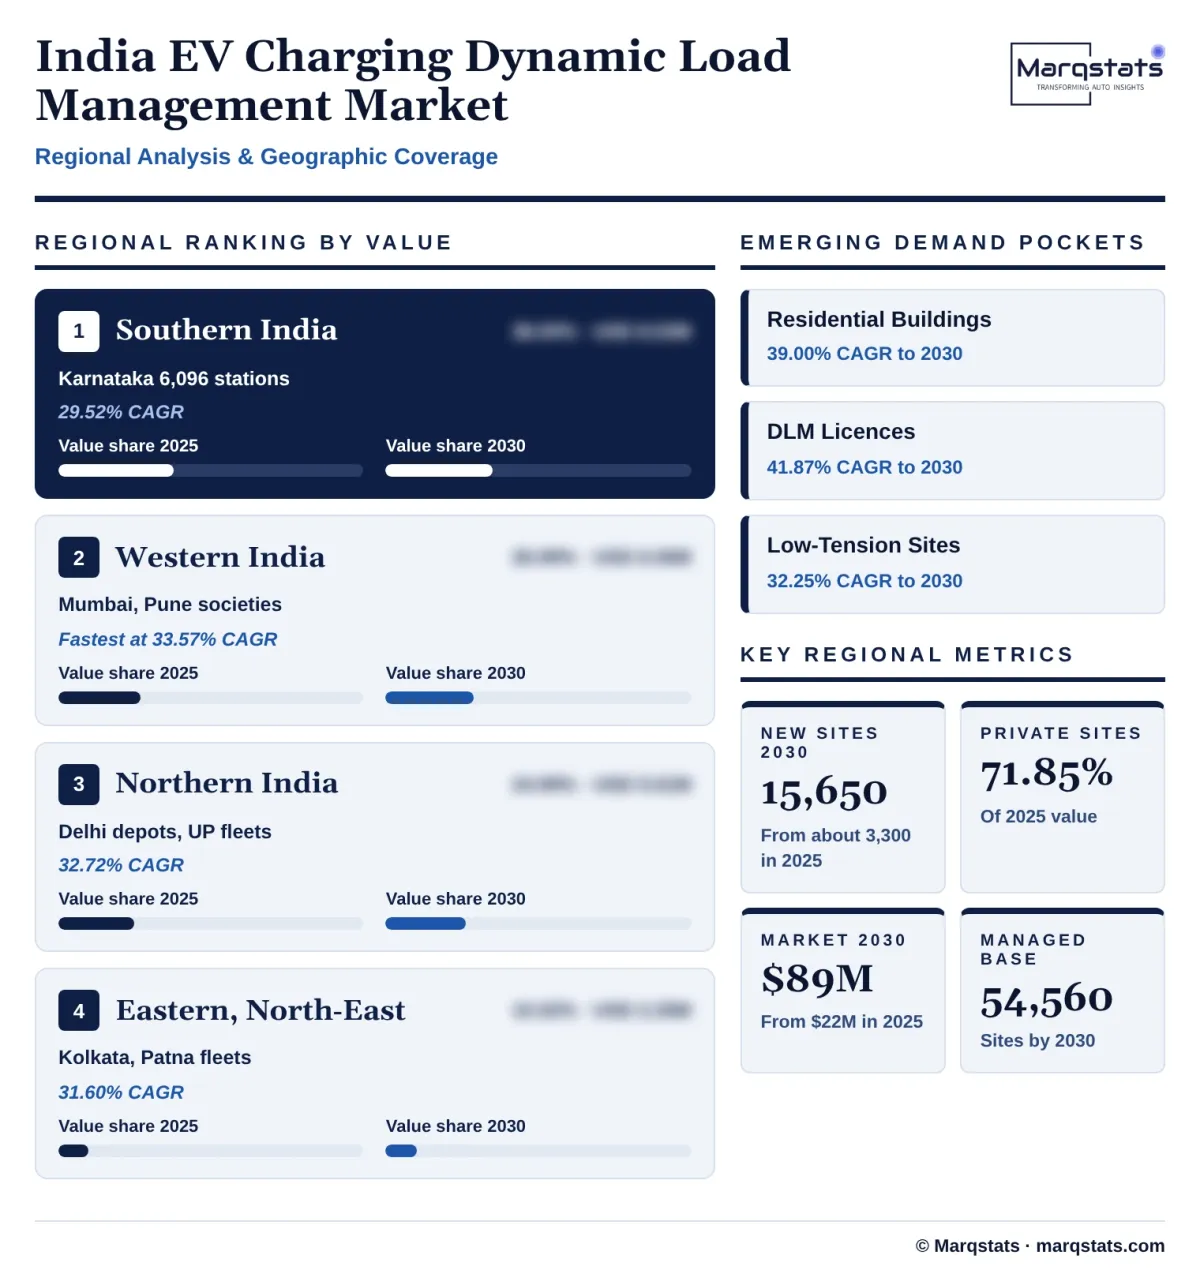
Residential multi-dwelling buildings account for 11.98% of 2025 value, USD 2.69 million, and grow fastest, at 39.00% a year, to USD 13.96 million and 15.72% of the market. About 1,050 housing societies added a controller in 2025, rising to 6,400 in 2030 as more residents buy electric cars.
Commercial and workplace sites account for 10.87% of 2025 value, USD 2.44 million, and grow at 29.51% a year to USD 8.89 million. Offices, IT parks, malls and hotels use DLM to run staff and visitor chargers within the spare capacity of an existing high-tension connection.
Sites on low-tension supply account for 46.28% of 2025 value, USD 10.39 million, and grow at 32.25% a year to USD 42.03 million. Most housing societies, small forecourts and city plazas sit here, where a load upgrade can force a move to high-tension supply, which is why DLM is bought to avoid it.
Sites on high-tension supply account for 53.72% of 2025 value, USD 12.06 million, and grow at 31.15% a year to USD 46.80 million. Bus depots, logistics parks, IT campuses and large plazas use sub-metering behind the existing high-tension meter, as the 2024 guidelines allow, and buy larger controllers with more integration.
By Geography
Southern India
Southern India accounts for 38.00% of 2025 value, USD 8.53 million, and grows at 29.52% a year to USD 31.09 million and 35.00% by 2030. Karnataka alone had 6,096 public charging stations, including 5,345 slow chargers, and Bengaluru tech parks, Tamil Nadu industrial belts and Kerala solar-hour tariffs make the south the largest region.
Western India
Western India accounts for 26.99% of 2025 value, USD 6.06 million, and grows fastest, at 33.57% a year, to USD 25.76 million and 29.00% by 2030. Maharashtra had 4,166 public stations including more than 1,200 fast chargers, and dense housing societies in Mumbai and Pune drive residential DLM, alongside Gujarat logistics hubs.
Northern India
Northern India accounts for 24.99% of 2025 value, USD 5.61 million, and grows at 32.72% a year to USD 23.10 million. Uttar Pradesh with 2,316 public stations and Delhi with 1,957 lead, with e-bus depots in Delhi and large three-wheeler fleets in Uttar Pradesh.
Eastern and North-Eastern India
Eastern and North-Eastern India account for 10.02% of 2025 value, USD 2.25 million, and grow at 31.60% a year to USD 8.88 million. West Bengal, Odisha, Bihar and Assam have fewer public stations, and demand comes mostly from e-bus depots and three-wheeler fleets in Kolkata, Bhubaneswar and Patna.
How Competition Is Evolving
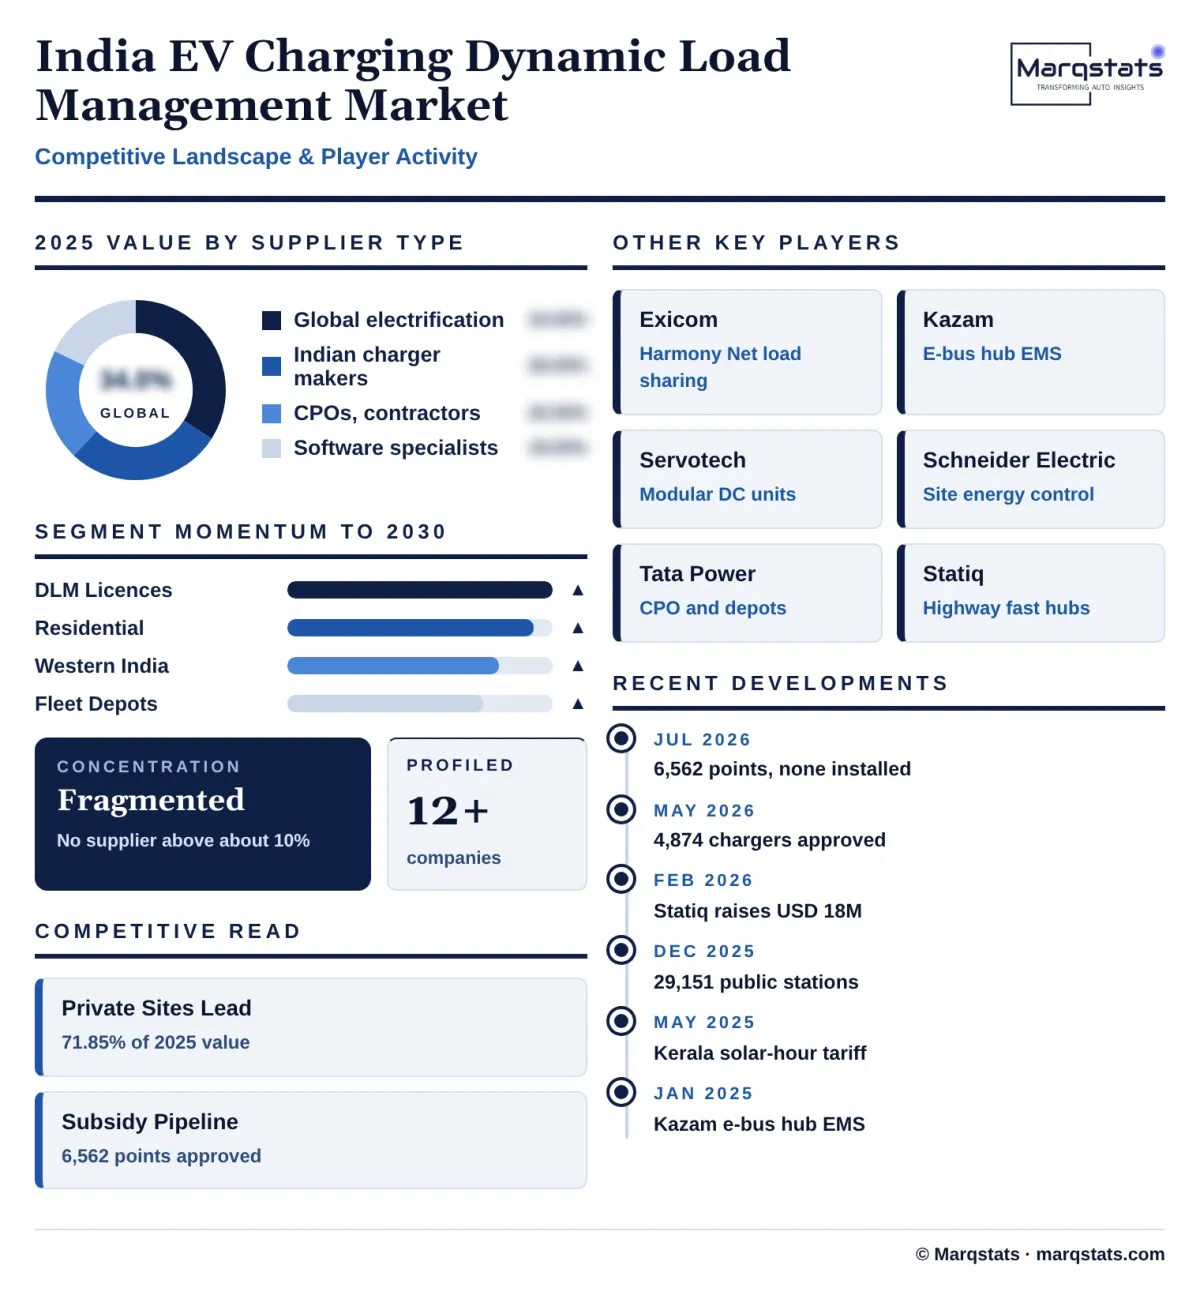
The market is fragmented. Marqstats estimates that global electrification firms such as Schneider Electric, ABB, Siemens and Delta Electronics supply about 34.00% of 2025 value, mainly at high-tension depots and campuses; Indian charger and power electronics makers such as Exicom Tele-Systems and Servotech about 28.00%; software and IoT specialists such as Kazam, Pulse Energy and Numocity about 18.00%; and charge point operators and electrical contractors that integrate in-house about 20.00%. No supplier holds more than about one tenth of value.
Indian charger makers compete by building load sharing into their own products. Exicom launched Harmony Direct 2.0 in May 2025 with dynamic load sharing between plugs and Harmony Net load management across chargers, and reports more than 150,000 chargers installed globally. Servotech supplies chargers and power electronics to oil marketing companies and builds load sharing into modular DC units.
Software specialists sell site and depot energy management. Kazam launched an energy management system for e-bus hubs in January 2025 and reports more than 50,000 chargers across more than 5,000 pincodes on its platform, while Pulse Energy and Numocity sell back-end and depot software to operators and fleets.
Charge point operators decide much of the public demand. Tata Power, ChargeZone and Statiq choose controllers and integrators for their hubs, and Statiq raised USD 18 million in February 2026 in a round led by Tenacity Ventures, with Y Combinator and Shell Ventures participating, to expand fast charging on highways.
Companies Covered
Companies covered in the report include:
Recent Market Activity
Table of Contents
Coverage & Segmentation
The study covers the India EV charging dynamic load management market, with 2025 as the base year, 2021 – 2025 as the historical period and 2026 – 2030 as the forecast period. It covers edge controllers, gateways and power-sharing panels, CT and sub-metering units used for load control, DLM software licences sold per site, and integration and commissioning services, segmented by component, deployment site, connection type and region. Values are at the supplier invoice in US dollars, before goods and services tax, and rupee figures use the 2025 average of INR 87.00 per US dollar.
Charger hardware, including chargers with built-in power sharing between guns, CSMS smart-charging modules sold inside back-end subscriptions, payment, roaming and booking platforms, transformers, battery storage, solar plants and civil works are excluded. CSMS smart-charging modules are counted in the Marqstats India Smart EV Charger study, so the two studies do not overlap. The live Marqstats India EV Charging Station report is a broader parent, and the live India Commercial EV Fleet Depot Energy Management Software report includes depot load-management software that overlaps with the fleet-depot licences here; their figures should not be added to this market.