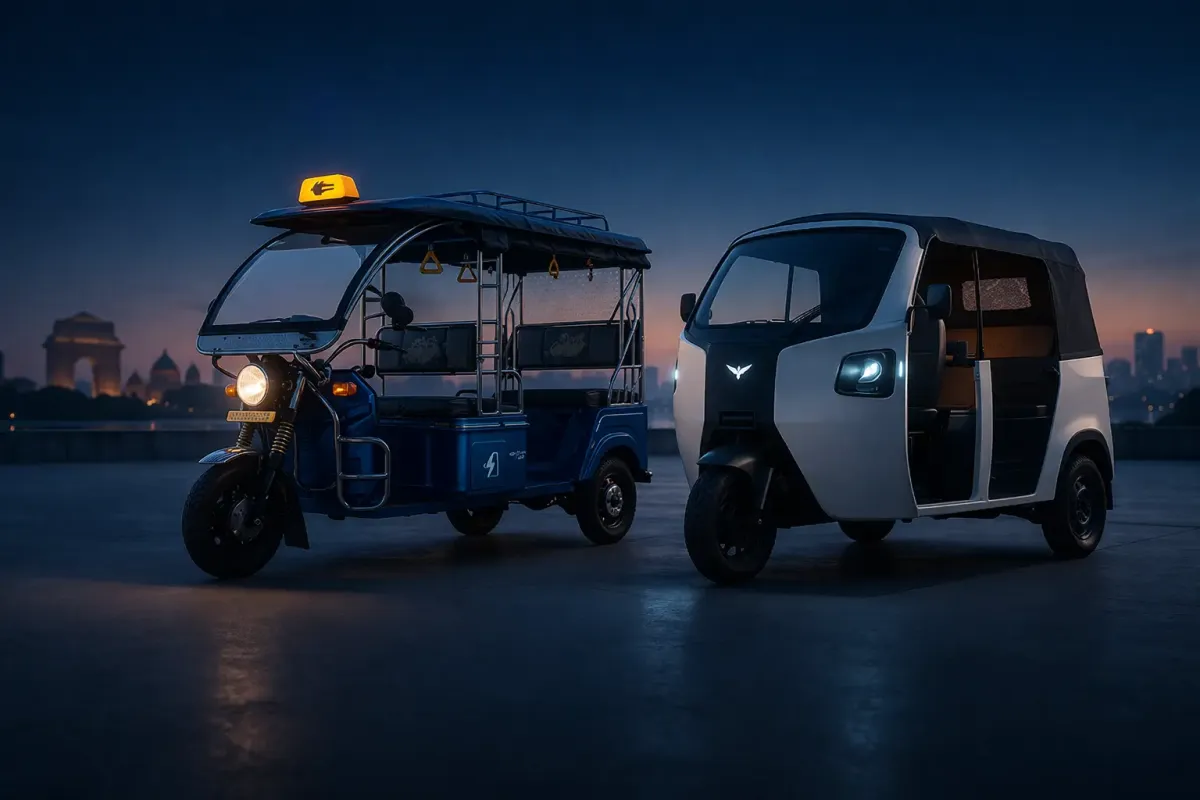
Market Snapshot
The India electric commercial vehicle market size is estimated at USD 1,493.08 million in 2025 and is projected to reach USD 4,513.22 million by 2030, growing at a CAGR of 24.76% over 2026 – 2030. Annual sales rise from about 253,549 to 566,300 vehicles as L5 three-wheelers, buses, light goods carriers and trucks scale.
Marqstats defines the market as the value of new battery-electric commercial vehicles registered in India each year: L5 passenger and cargo three-wheelers, light goods carriers such as the Tata Ace EV, Mahindra Zeo and Euler Storm EV, electric buses, and medium and heavy electric trucks. Value is counted at ex-showroom prices net of GST and before PM E-DRIVE incentives, converted at INR 87.00 per US dollar. L3 e-rickshaws and e-carts, electric cars and used vehicles are excluded.
Electric three-wheelers in the L5 class account for 57.59% of 2025 value and 93.63% of units, while electric buses account for 29.47% of value. Medium and heavy electric trucks are the fastest-growing segment, at 70.67% a year, and South India is the largest region with 29.00% of value.
Key Takeaways
Market Overview & Analysis
Report Summary
Marqstats sizes the India electric commercial vehicle market as the value of new battery-electric vehicles bought for commercial carriage of goods or passengers and registered on the Vahan portal of the Ministry of Road Transport and Highways each year. It covers four vehicle types: L5 three-wheelers, both passenger autos (L5M) and cargo carriers (L5N); light goods carriers in categories N1 and light N2; electric buses in categories M2 and M3; and medium and heavy electric trucks in categories N2 and N3 up to 55 tonnes.
The 2025 market is built bottom-up. Marqstats estimates 207,005 L5 passenger and 30,383 L5 cargo three-wheelers, 11,155 light goods carriers, 4,441 buses and 565 medium and heavy trucks, a total of 253,549 vehicles worth USD 1,493.08 million, or INR 12,989.80 crore at INR 87.00 per US dollar. The forecast runs year by year to 2030 as a single trajectory.
The market splits into two very different businesses. On three wheels, electric vehicles are already mainstream: electric models took 60.90% of all three-wheeler retail sales in 2025 when L3 e-rickshaws are included, and 31.8% of L5 passenger sales. On four or more wheels, electrification is just starting: the 16,161 electric light goods carriers, buses and trucks registered in 2025 equal 1.60% of the 1,009,654 commercial vehicles retailed by dealers that year, according to the Federation of Automobile Dealers Associations (FADA).
That split decides where the value goes. L5 three-wheelers bring 57.59% of 2025 value from 93.63% of units, while buses bring 29.47% of value from fewer than 2% of units because each one sells for about USD 99,077. By 2030, Marqstats expects buses and trucks together to reach 48.40% of value, against 34.25% in 2025.
The report also states its boundaries with related Marqstats studies. L3 e-rickshaws and e-carts, 560,339 units in 2025, belong to the India E-Rickshaw market and are excluded here. The all-powertrain India Three-Wheeler, India Bus and India Truck markets contain the electric slices sized here, and the live India Electric Three-Wheeler, India Electric Bus and India Electric Truck reports cover overlapping vehicles, so their figures should not be added to this market.
India Electric Commercial Vehicle Market Size and Forecast
The India electric commercial vehicle market grows from USD 1,493.08 million in 2025 to USD 4,513.22 million in 2030, a CAGR of 24.76%. Volume drives most of the growth: sales rise at 17.43% a year, from about 253,549 to 566,300 vehicles, while the average value per vehicle rises at 6.24% a year, from about USD 5,889 to USD 7,970, because buses and trucks grow faster than three-wheelers even as battery prices fall.
The base year is built from registrations and prices. Marqstats values L5 passenger three-wheelers at about INR 3.10 lakh each (USD 3,563), giving USD 737.60 million, and L5 cargo three-wheelers at INR 3.50 lakh (USD 4,023), giving USD 122.23 million. Light goods carriers are valued at INR 9.50 lakh (USD 10,920), or USD 121.81 million, and medium and heavy trucks at INR 1.10 crore (USD 126,437), or USD 71.44 million. Prices are ex-showroom, net of the 5% GST on electric vehicles and before incentives.
Electric buses are aligned with the live Marqstats India Electric Bus report at USD 440.00 million for 4,441 buses in 2025, an average of about USD 99,077 or INR 86.20 lakh per bus across 9-metre and 12-metre city buses, staff buses and smaller midi buses. The goods vehicles sized here, light carriers and trucks together, come to USD 193.25 million in 2025, close to the USD 180 million in the live India Electric Truck report, which uses a different weight taxonomy.
Unit counts come from two registration series. Vahan data reported in January 2026 showed 15,798 electric commercial vehicles in 2025, made up of 10,759 light goods carriers, 4,395 buses and 565 heavy goods carriers, while a refreshed Vahan extract published in September 2026 showed 16,695 vehicles including 11,155 light goods carriers. Marqstats uses the refreshed light-goods and bus counts, keeps the 565 heavy goods carriers, and excludes about 534 vehicles in other transport categories. For three-wheelers, Vahan recorded 797,727 electric three-wheelers in 2025; deducting the 560,339 L3 e-rickshaws and e-carts reported by FADA leaves 237,388 L5 vehicles, which Marqstats splits by the 31.8% passenger and 21.6% cargo penetration rates reported for the year.
2026 is the year of the largest step. Vahan data showed 23,540 electric commercial vehicles of four wheels or more in January to August 2026, up 155%, including 17,292 light goods carriers, 4,556 buses and 1,637 heavy goods carriers. Marqstats estimates about 304,600 vehicles and USD 2,255.99 million for the full year, including about 27,000 light goods carriers, 7,000 buses and 2,600 medium and heavy trucks, with growth then settling near 19.71% a year by 2030.
Marqstats tracks four indicators to monitor the forecast: monthly Vahan registrations of heavy goods carriers against the roughly 5,600 trucks supported by the PM E-DRIVE truck incentive, deliveries against the 10,900 buses in the Convergence Energy Services Limited tenders, L5 penetration after the incentive closed in December 2025, and battery and vehicle price cuts announced by Tata Motors, Mahindra, Bajaj Auto and Euler Motors.
Market Dynamics
Key Drivers
Five forces are pulling India's commercial fleets toward battery-electric vehicles, and they work at very different speeds on three wheels and on four.
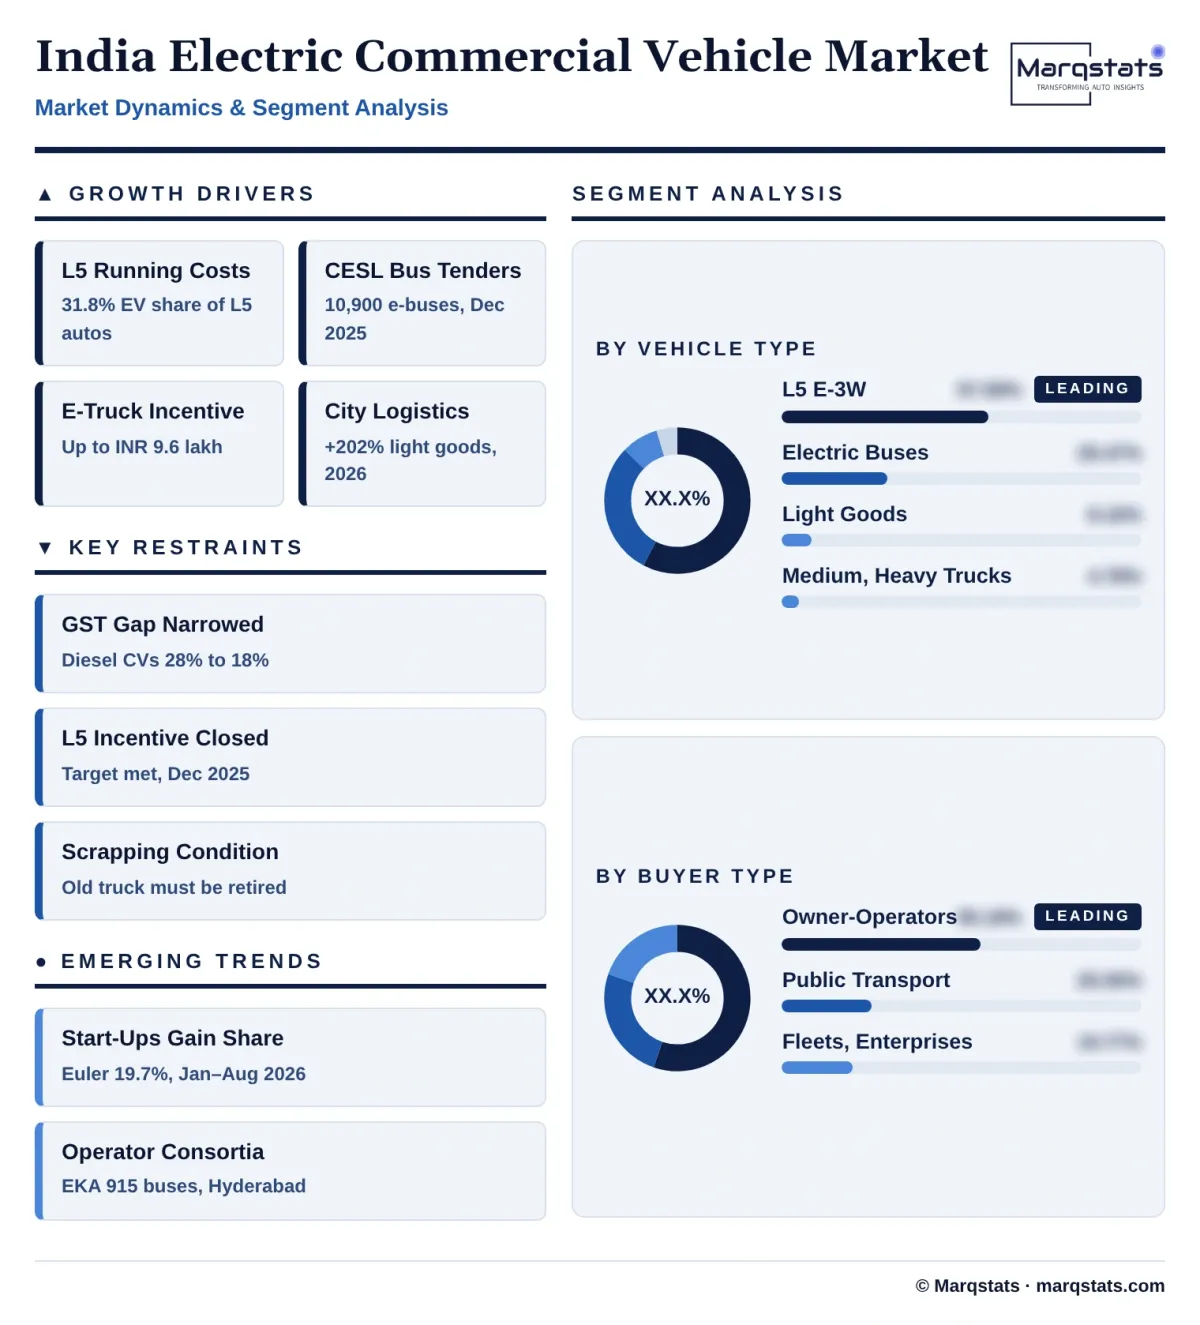
- Running costs make electric L5 three-wheelers the default choice in many cities. Electric models took 31.8% of L5 passenger sales in 2025, up from 20.8% in 2024, and Bajaj Auto and TVS Motor turned electric autos into core products, with Bajaj selling 78,546 electric three-wheelers in 2025 and TVS 21,005. Drivers who run 100 kilometres or more a day earn back the price gap quickly, which is why sales kept growing after subsidies were cut.
- Public bus procurement has reached scale. Convergence Energy Services Limited (CESL) concluded tenders for 10,900 electric buses under PM E-DRIVE on 25 December 2025, about 4,500 for Bengaluru, 2,800 for Delhi, 2,000 for Hyderabad and 1,600 for Ahmedabad and Surat, and the Ministry of Heavy Industries extended PM E-DRIVE to 31 March 2028 with an outlay of INR 10,900 crore. These orders are about 2.5 times the 4,441 electric buses registered in 2025.
- A first truck incentive is pulling heavy fleets in. On 11 July 2025 the Ministry of Heavy Industries launched incentives of up to INR 9.6 lakh per electric truck for N2 and N3 vehicles from 3.5 to 55 tonnes, for about 5,600 trucks, with about 1,100 reserved for Delhi. Heavy goods registrations rose 618% to 1,637 units in January to August 2026, led by Sany Heavy Industry India with 797 units.
- Urban logistics fleets are switching light goods carriers. Electric light goods carrier registrations rose from 11,155 in 2025 to 17,292 in just the first eight months of 2026, up 202%, as e-commerce, parcel and grocery fleets moved city routes to the Tata Ace EV, Mahindra Zeo and Euler Storm EV. Predictable routes and overnight depot charging suit these vehicles better than any other freight use.
- Tax keeps electric vehicles cheaper to buy. Electric vehicles stayed at 5% GST when the GST Council reset vehicle rates from 22 September 2025, so an electric goods carrier or bus still carries 13 percentage points less tax than a diesel or CNG equivalent taxed at 18%, which matters most for fleets that cannot reclaim input tax.
Key Restraints
Four constraints hold electric adoption down outside the three-wheeler and city-bus niches.
- The GST reset narrowed the electric price advantage. From 22 September 2025, GST on commercial vehicles, buses and three-wheelers fell from 28% to 18%, while electric vehicles stayed at 5%. The tax gap shrank from 23 to 13 percentage points, so diesel and CNG goods carriers became about 8% cheaper to buy overnight and some fleet buyers delayed electric orders.
- Subsidies for three-wheelers are ending. The L5 incentive under PM E-DRIVE closed in late December 2025 after the 288,000-unit target was met, and incentives for electric two- and three-wheelers end on 31 March 2026. Each L5 buyer lost up to INR 25,000 of support, about 8% of the INR 3.10 lakh Marqstats average L5 passenger price, which slows sales to price-sensitive owner-drivers.
- The truck incentive needs a truck to scrap. Buyers must retire an old truck to qualify for the PM E-DRIVE truck incentive, which suits large fleets with ageing vehicles but excludes first-time owners and operators adding capacity. The maximum of INR 9.6 lakh is about 8.73% of the INR 1.10 crore Marqstats average price of a medium or heavy e-truck, so financing, not the subsidy, decides most purchases.
- Upfront prices and charging limit four-wheel adoption. Electric trucks and buses cost far more than diesel models, intercity freight corridors still lack high-power charging, and bus operators under gross cost contracts must fund depots and grid connections before any bus earns revenue. These costs keep four-wheel-and-above electric vehicles at 1.60% of commercial vehicle retail sales in 2025.
Key Trends
Four shifts are changing who builds, buys and finances electric commercial vehicles in India.
- Start-ups take share from incumbents in light goods. Euler Motors registered 4,637 electric commercial vehicles in January to August 2026, up from 330 a year earlier, for 19.7% of the segment, while Tata Motors held 33.4% with 7,867 units after falling to 30% in 2025 from 60% in 2024. Euler added a four-wheeler line at Palwal, Haryana, for INR 100 crore with capacity for up to 24,000 vehicles a year.
- Bus orders move to operator consortia. Under the gross cost contract model, operators own, run and maintain the buses and are paid per kilometre. EKA Mobility won a letter of award with GreenCell Mobility for 915 buses in Hyderabad in March 2026, 100 of 9 metres and 815 of 12 metres, and with Chartered Speed for 1,750 buses in Bengaluru, so bus makers now compete as part of financing and operating teams.
- Heavy electric trucks start in closed-loop haulage. Cement, steel, port and mining operators deploy electric tippers and tractors on fixed routes where they can charge at the site, which is why Sany Heavy Industry India, IPLTech Electric and Blue Energy Motors lead the early heavy segment rather than the national truck brands.
- Incumbents restructure for commercial vehicles. Tata Motors separated its commercial vehicle business, effective 1 October 2025, and listed it on 12 November 2025, while Ashok Leyland runs its electric buses and light carriers through Switch Mobility. Incumbents now have the balance sheets to defend electric light goods and bus share.
Strategic Implications
- For three-wheeler makers, the end of the L5 incentive turns competition toward price, battery warranty and financing. Makers that offer low-cost loans and resale guarantees to owner-drivers hold share, because the product itself is no longer new.
- For bus makers, winning a tender is no longer enough. The 10,900 CESL buses go to consortia that can finance, build depots and run services for many years, so makers without an operator partner and a working-capital line risk being left out of the next round.
- For light goods carrier makers, the market is moving from pilots to fleet contracts. Uptime guarantees, telematics and depot charging bundled with the vehicle win e-commerce and parcel fleets more often than a lower list price.
- For truck makers and fleets, the PM E-DRIVE truck budget is small, so the real opportunity is the closed-loop haulage of cement, steel, ports and mining, where Marqstats expects medium and heavy trucks to reach about 9,000 units a year by 2030.
- For financiers and battery suppliers, the move to buses and trucks raises the ticket size per vehicle about 30 times above an L5 three-wheeler, so leasing, battery-as-a-service and residual value products become the main lever for faster adoption.
Market Segmentation
L5 three-wheelers account for 57.59% of 2025 value, USD 859.83 million, and grow at 13.53% a year to USD 1,621.84 million. Marqstats estimates 207,005 passenger autos worth USD 737.60 million and 30,383 cargo carriers worth USD 122.23 million in 2025, rising to about 400,000 and 70,000 units by 2030. Mahindra Last Mile Mobility, Bajaj Auto, TVS Motor and Piaggio Vehicles lead, and the segment keeps growing without the PM E-DRIVE incentive that closed in December 2025.
Electric buses account for 29.47% of 2025 value, USD 440.00 million from 4,441 buses, and grow at 21.19% a year to USD 1,150.00 million and about 12,300 buses by 2030. PMI Electro Mobility, Olectra Greentech, Switch Mobility and JBM Auto led 2025 registrations, and the 10,900-bus CESL tender, mostly for 9-metre and 12-metre city buses, carries most of the growth to 2028.
Light goods carriers account for 8.16% of 2025 value, USD 121.81 million from 11,155 vehicles, and grow at 42.15% a year to USD 706.90 million and about 75,000 vehicles by 2030. They include sub-one-tonne and one-to-two-tonne carriers such as the Tata Ace EV, Mahindra Zeo and Euler Storm EV, and the Switch Mobility IeV range, sold to e-commerce, parcel, grocery and municipal fleets.
Medium and heavy trucks account for 4.78% of 2025 value, USD 71.44 million from 565 vehicles, and grow fastest, at 70.67% a year, to USD 1,034.48 million and about 9,000 vehicles by 2030. Electric tippers and tractors from Sany Heavy Industry India, IPLTech Electric, Blue Energy Motors and Tata Motors serve cement, steel, ports and mining, and the PM E-DRIVE truck incentive supports about 5,600 of them.
Passenger vehicles, L5 autos and buses, account for 78.87% of 2025 value, USD 1,177.60 million, and grow at 16.31% a year to USD 2,506.32 million. Shared autos in Tier 2 and Tier 3 cities and city buses in the metros make passenger carriage the larger function today.
Goods vehicles, L5 cargo carriers, light goods carriers and trucks, account for 21.13% of 2025 value, USD 315.48 million, and grow at 44.78% a year to USD 2,006.90 million and 44.47% of the market by 2030. Freight is where electrification is youngest, and where trucks lift the value per vehicle most.
Owner-drivers and small operators account for 55.18% of 2025 value, USD 823.84 million, and grow at 15.17% a year to USD 1,668.97 million. They buy most L5 autos and many light goods carriers, usually with dealer or non-bank loans, and are the buyers most exposed to the end of three-wheeler incentives.
Logistics, e-commerce, industrial and staff-transport fleets account for 19.77% of 2025 value, USD 295.24 million, and grow fastest, at 45.14% a year, to USD 1,901.25 million and 42.13% of the market by 2030, as electric light goods carriers and trucks move from pilots to fleet contracts.
State transport undertakings, city bus companies and their gross cost contract operators account for 25.05% of 2025 value, USD 374.00 million, and grow at 20.32% a year to USD 943.00 million. Their purchases follow PM E-DRIVE and PM-eBus Sewa tenders, so deliveries come in waves.
By Geography
West India
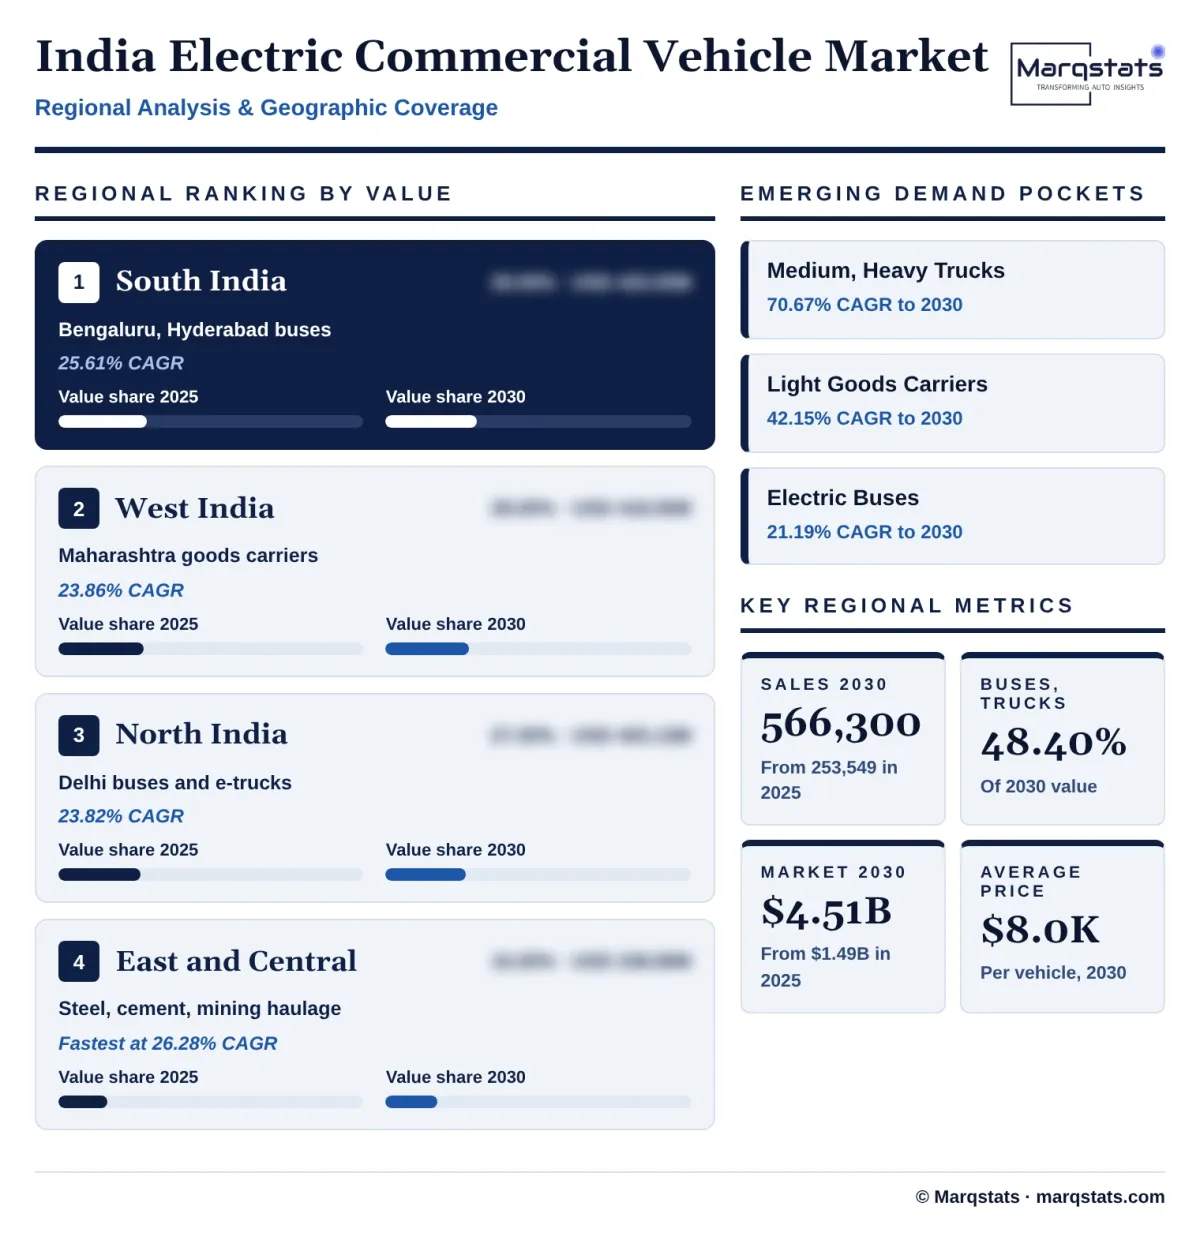
West India accounts for 28.00% of 2025 value, USD 418.06 million, and grows at 23.86% a year to USD 1,218.57 million. Maharashtra led electric goods carrier registrations in 2025, Mumbai and Nagpur are among the top e-bus cities, and Ahmedabad and Surat share about 1,600 buses in the CESL tender. Fleet owners register many vehicles at head offices in Mumbai and Pune, so registrations slightly overstate where vehicles run.
South India
South India is the largest region, with 29.00% of 2025 value, USD 433.00 million, and grows at 25.61% a year to USD 1,353.96 million and 30.00% by 2030. Bengaluru takes about 4,500 buses and Hyderabad about 2,000 in the CESL tender, Karnataka and Tamil Nadu are dense markets for L5 autos and e-commerce carriers, and TVS Motor and TI Clean Mobility build electric three-wheelers in Tamil Nadu.
North India
North India accounts for 27.00% of 2025 value, USD 403.13 million, and grows at 23.82% a year to USD 1,173.44 million. Delhi is the leading e-bus city, takes about 2,800 buses in the CESL tender and has about 1,100 trucks reserved under the PM E-DRIVE truck incentive, while Uttar Pradesh buys most of its electric three-wheelers in the L3 class that is outside this market.
East and Central India
East and Central India account for 16.00% of 2025 value, USD 238.89 million, and grow fastest, at 26.28% a year, to USD 767.25 million and 17.00% by 2030. Steel, cement and mining belts in Odisha, Jharkhand, Chhattisgarh and Madhya Pradesh are natural sites for electric tippers and tractors on closed routes, and L5 sales grow from a low base in Bihar and West Bengal.
How Competition Is Evolving
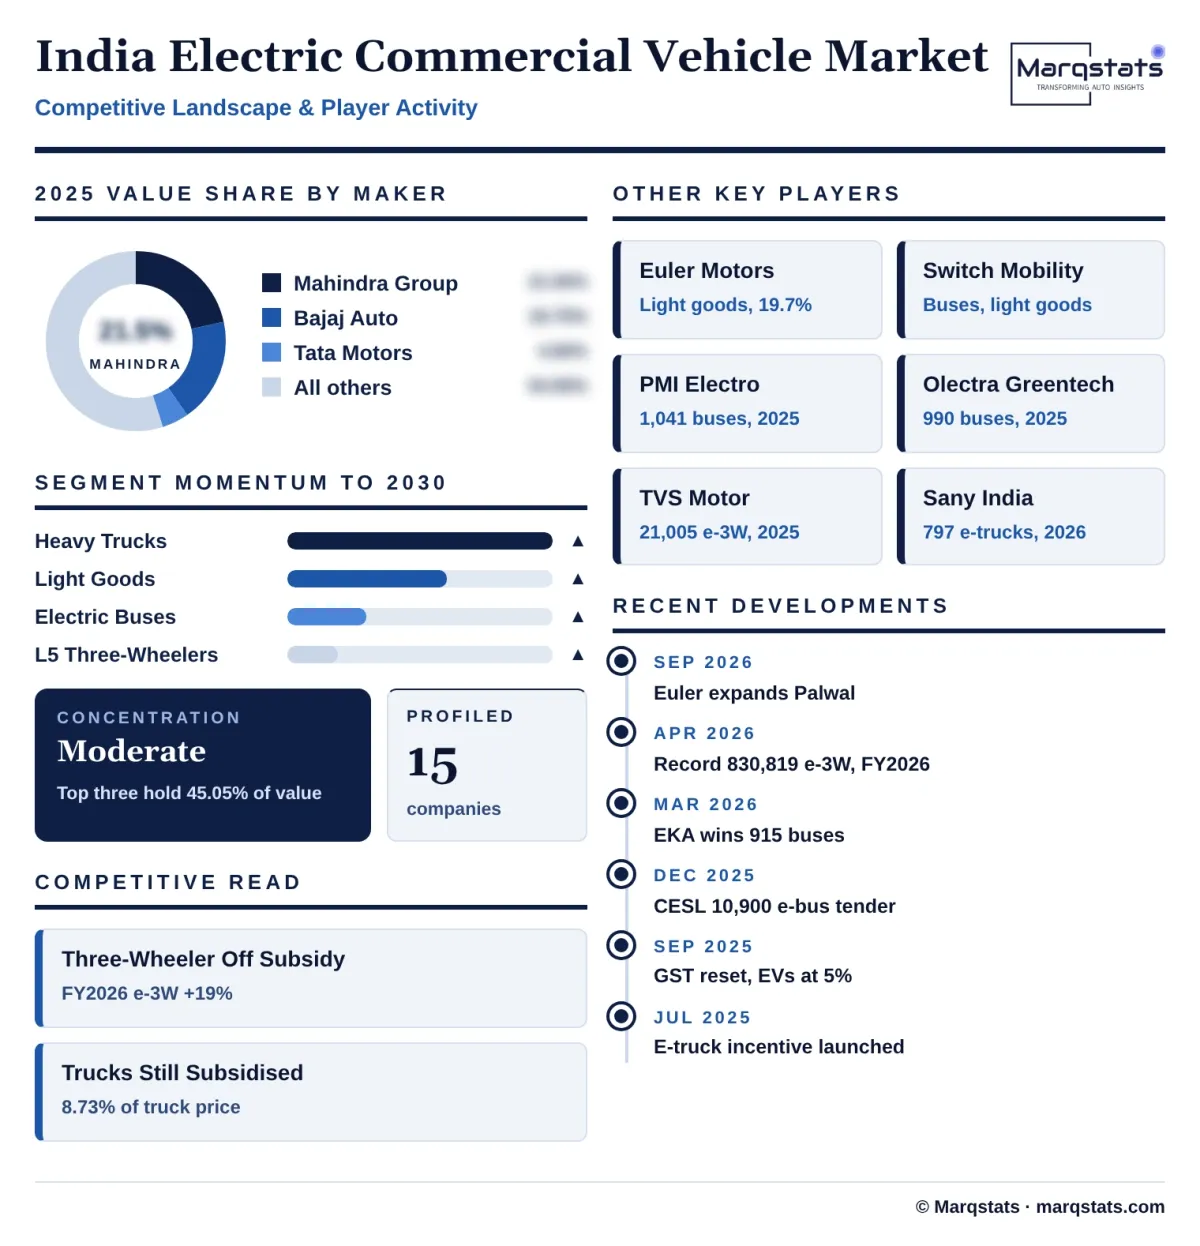
The market is moderately fragmented and split by vehicle type. Marqstats estimates that Mahindra Group held about 21.50% of 2025 value, Bajaj Auto about 18.75% and Tata Motors about 4.80%, with the other 54.95% shared among bus makers, light goods carrier start-ups, truck makers and more than a dozen three-wheeler brands. No company leads in all four vehicle types, and each segment has a different leader.
In L5 three-wheelers, Mahindra Last Mile Mobility and Bajaj Auto are close rivals. Mahindra Last Mile Mobility sold 95,907 electric three-wheelers in 2025, including some L3 models, and says it held 39.7% of the L5 class in FY2026, while Bajaj Auto sold 78,546, up 87%, and outsold Mahindra in January and February 2026. TVS Motor rose to 21,005 units in its first full year and Piaggio Vehicles fell to 14,832.
In light goods carriers and buses, the order changes. Tata Motors registered 4,785 electric commercial vehicles of four wheels or more in 2025, down 20%, followed by Mahindra Last Mile Mobility with 2,548, Switch Mobility with 1,897 and Euler Motors with 1,053, and in January to August 2026 Euler rose to second place with 19.7%. Among buses, PMI Electro Mobility registered 1,041 units in 2025, Olectra Greentech 990, Switch Mobility 950 and JBM Auto 698, with Pinnacle Mobility (EKA) winning large CESL contracts for 2026 onward.
Competition is moving from product to finance and operations. Bus contracts go to maker-operator consortia, truck sales depend on fleets that can scrap old trucks and fund charging, and three-wheeler makers compete on loans, warranties and resale value now that the incentive has closed. Companies with captive finance or operator partners are best placed to win share to 2030.
Companies Covered
Companies covered in the report include:
Recent Market Activity
Table of Contents
Coverage & Segmentation
The study covers the India electric commercial vehicle market, with 2025 as the base year, 2021 – 2025 as the historical period and 2026 – 2030 as the forecast period. It covers new battery-electric L5 passenger and cargo three-wheelers, light goods carriers, buses and medium and heavy trucks registered in India, segmented by vehicle type, function, buyer type and region. Values are ex-showroom prices net of GST and before PM E-DRIVE incentives, converted at the 2025 average of INR 87.00 per US dollar.
L3 e-rickshaws and e-carts (560,339 units in 2025, sized in the India E-Rickshaw market), electric cars and SUVs used as taxis, electric two-wheelers, electric tractors and off-road machines, used vehicles and charging equipment are excluded. The all-powertrain India Three-Wheeler, India Bus and India Truck markets contain the electric vehicles counted here, and the live Marqstats India Electric Three-Wheeler, India Electric Bus, India Electric Truck and India Electric LCV reports cover overlapping vehicles, so figures from those reports should not be added to this market.