Market Snapshot
Middle bar: base-year value × (1 + CAGR), rounded to two decimals. This is a calculated illustration, not a separately researched annual estimate.
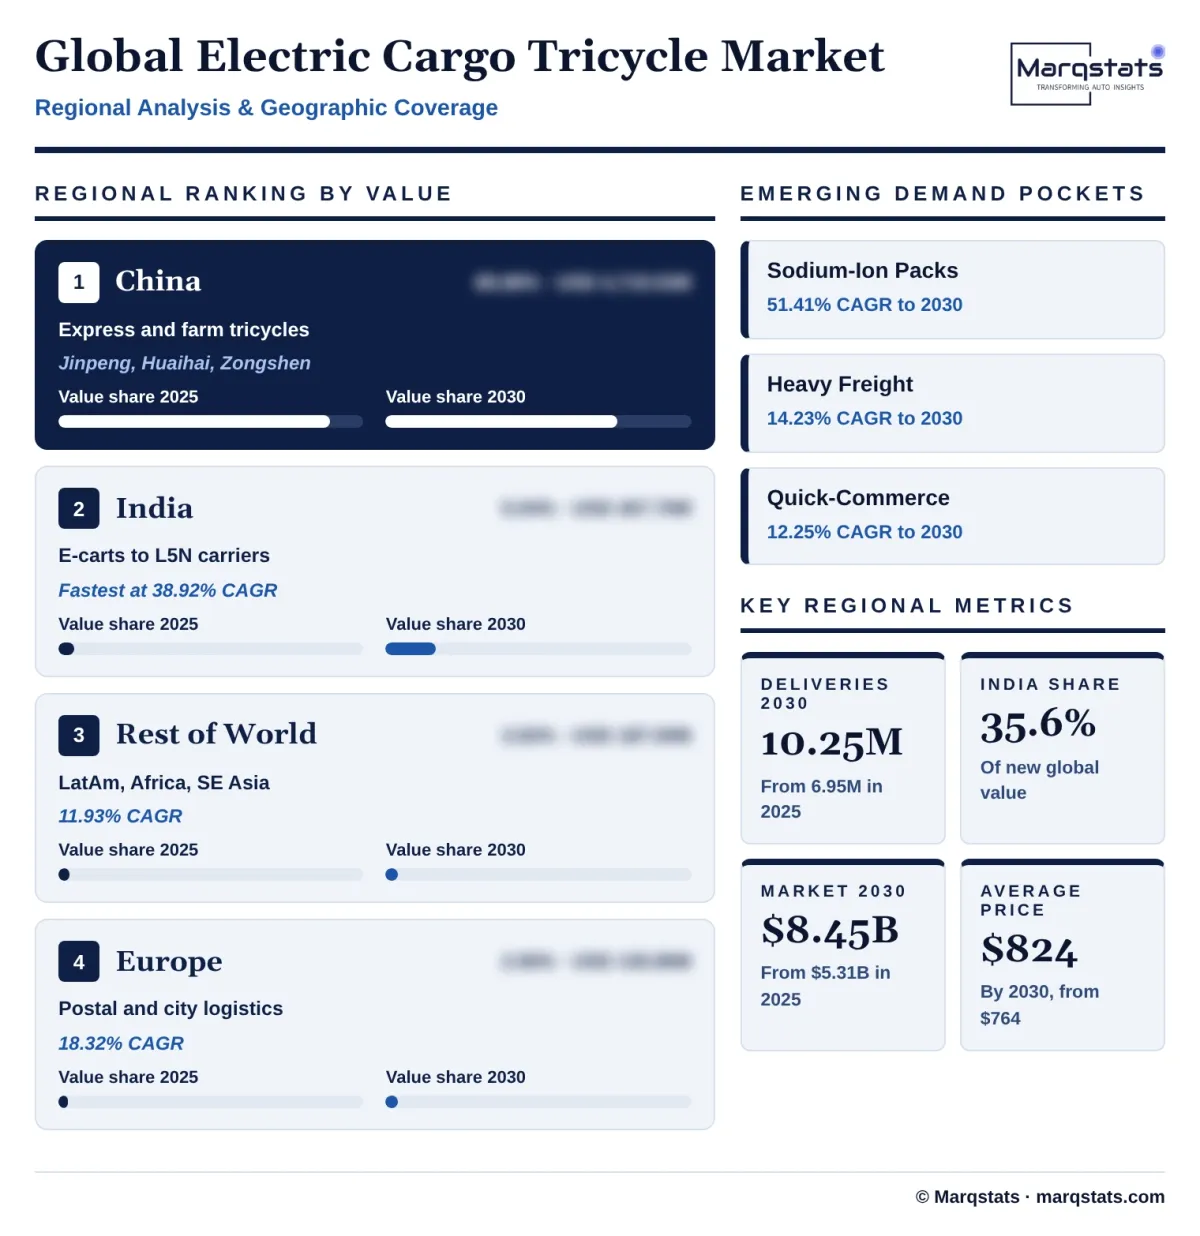
The global electric cargo tricycle market size is estimated at USD 5,310.09 million in 2025 and is projected to reach USD 8,450.00 million by 2030, growing at a CAGR of 9.74% over 2026 – 2030. Annual deliveries rise from about 6.95 million to 10.25 million vehicles, an 8.08% annual rate, while the average ex-factory price rises from about USD 764 to USD 824 as buyers move to larger, lithium-powered and automotive-grade vehicles.
Marqstats defines the market as the ex-factory wholesale value, excluding taxes, subsidies and dealer margins, of new battery-electric three-wheelers built to carry goods. It covers parcel and express delivery tricycles, grocery and quick-commerce delivery vehicles, municipal sanitation and utility tricycles, and agricultural and rural cargo tricycles, including Indian L3 e-carts and L5N goods carriers and European L2e-U and L5e-B utility vehicles. Passenger three-wheelers and e-rickshaws, pedal cargo bikes, two-wheeled delivery scooters and four-wheeled micro-trucks are excluded.
Medium-payload vehicles of 300 kg to 600 kg account for an estimated 42.00% of 2025 value and lithium iron phosphate batteries for 68.00%. China accounts for 88.88% of 2025 value and India for 5.04%. The study segments the market by payload capacity, battery chemistry, application and region.
Key Takeaways
Market Overview & Analysis
Report Summary
Marqstats sizes the electric cargo tricycle market as the ex-factory wholesale value of new battery-electric three-wheelers built to carry goods. In 2025 about 6.95 million such vehicles were delivered worldwide, worth an estimated USD 5,310.09 million at an average ex-factory price of about USD 764.
The market spans very different vehicles. At one end are Chinese express delivery tricycles and farm utility tricycles with 1.5 kW to 2.2 kW motors, lead-acid or lithium batteries and ex-factory prices of a few thousand yuan. At the other end are automotive-grade goods carriers such as the Mahindra Treo Zor, Bajaj Maxima Cargo EV, Euler HiLoad and TVS King Kargo HD EV in India, and the Kyburz and Piaggio utility vehicles in Europe, with liquid-cooled or high-capacity lithium packs, cabins, telematics and prices of USD 4,000 to USD 8,000.
Rules differ by country. India classifies low-speed e-carts with a top speed of 25 km/h as category L3 and higher-speed goods carriers with speeds of up to about 60 km/h as L5N, which need commercial registration. China regulates express delivery tricycles through a national technical standard for postal tricycles and local registration rules. The European Union approves three-wheeled utility mopeds as L2e-U and heavier commercial tricycles as L5e-B under Regulation (EU) No 168/2013, with full vehicle type approval.
China dominates volume. Marqstats estimates about 6.6 million electric cargo tricycles were delivered in China in 2025, built in large clusters in Jiangsu, Henan and Shandong by groups such as Jinpeng, Huaihai and Zongshen and sold to express delivery firms, retailers, farmers and municipal fleets. India delivered about 113,000 electric goods three-wheelers, of which about 83,400 were L3 e-carts and about 29,500 were L5N goods carriers. Europe delivered about 18,500 utility tricycles, and other markets about 220,000.
The market grew from USD 3,180.00 million in 2021 to USD 3,610.00 million in 2022, USD 4,090.00 million in 2023 and USD 4,650.00 million in 2024, a 13.68% annual rate over 2021 – 2025, driven by the growth of parcel delivery in Chinese cities and electric goods carriers in India. Marqstats expects about 7.55 million deliveries worth USD 5,868.00 million in 2026.
Electric cargo tricycles sit inside a much larger three-wheeler industry. India alone sold 797,733 electric three-wheelers of all types in calendar 2025, up 15.39%, most of them passenger e-rickshaws and L5 passenger autos, which fall outside the market sized here. Goods carriers are a smaller but faster-changing part of that market, because fleet customers such as e-commerce, grocery and parcel companies judge vehicles on running cost, uptime and payload rather than purchase price alone.
Global Electric Cargo Tricycle Market Size and Forecast
The global electric cargo tricycle market grows from USD 5,310.09 million in 2025 to USD 8,450.00 million in 2030, a CAGR of 9.74%. Marqstats expects USD 6,450.00 million in 2027, USD 7,070.00 million in 2028 and USD 7,735.00 million in 2029. Annual deliveries rise from about 6.95 million to 7.55 million in 2026, 8.16 million in 2027, 8.81 million in 2028, 9.50 million in 2029 and 10.25 million in 2030.
Value grows faster than volume. The average ex-factory price rises from about USD 764 in 2025 to USD 824 in 2030 because the mix moves toward medium and heavy payload vehicles, lithium and sodium-ion batteries and Indian L5N goods carriers, which more than offsets falling battery cell prices.
China drives volume and India drives value. Chinese deliveries grow from about 6.6 million to 9.25 million vehicles, a 7.00% annual rate, but Chinese value grows at only 6.35% a year as prices fall in a mature market. Indian deliveries grow from about 113,000 to 590,000, and Indian value grows at 38.92% a year as the share of L5N goods carriers rises.
Battery chemistry changes fastest. Marqstats estimates lead-acid batteries were fitted to about 38% of vehicles in 2025 but fall to about 10% by 2030, while sodium-ion rises from about 4% to 22% of deliveries. Lithium iron phosphate remains the main chemistry, rising from about 58% to 68% of deliveries and from 68.00% to 74.00% of value.
Marqstats tracks four indicators to monitor the forecast: Chinese express parcel volumes and delivery fleet replacement, Indian L5N and e-cart registrations, the price of lithium iron phosphate and sodium-ion cells, and European postal and city logistics fleet orders. Faster quick-commerce growth in India or new zero-emission delivery rules in Chinese and European cities would lift the market above the base path, while weaker parcel growth in China would slow it.
The forecast is most sensitive to Chinese prices. Because China accounts for 88.88% of 2025 value, a change of RMB 100 in the average ex-factory price of a Chinese cargo tricycle moves the 2025 market by about USD 92 million, or about 1.7%. In India, each percentage point of goods volume that moves from e-carts to L5N carriers adds roughly USD 2.8 million of value because an L5N vehicle sells for about 2.4 times the price of an e-cart.
Market Dynamics
Key Drivers
Five forces are expanding demand for electric cargo tricycles.
- Parcel and grocery delivery is growing. E-commerce, express parcel and quick-commerce companies in China and India need low-cost vehicles that can carry 300 kg to 600 kg through narrow, crowded streets, and electric cargo tricycles cost far less to run than petrol, diesel or CNG vehicles.
- Lithium batteries are getting cheaper. Falling prices for lithium iron phosphate cells let manufacturers fit larger, longer-lasting packs, giving goods carriers more range and fewer battery replacements.
- Sodium-ion batteries are arriving. BYD battery unit FinDreams and Huaihai formed a joint venture in 2024 to build a 30 GWh sodium-ion plant in Xuzhou, offering cheaper cells that work better in cold weather.
- Fleets are moving to automotive-grade vehicles. Indian L5N goods carriers with telematics, fast charging and payloads of 500 kg or more are winning orders from logistics firms, supported by new launches from Mahindra, Bajaj, TVS, Euler, Omega Seiki and Altigreen.
- Cities restrict combustion vehicles. Low-emission zones and delivery rules in European cities, and restrictions on older diesel goods vehicles in Indian cities such as Delhi, push delivery fleets to electric vehicles.
Key Restraints
Four constraints slow the move to higher-value electric cargo tricycles.
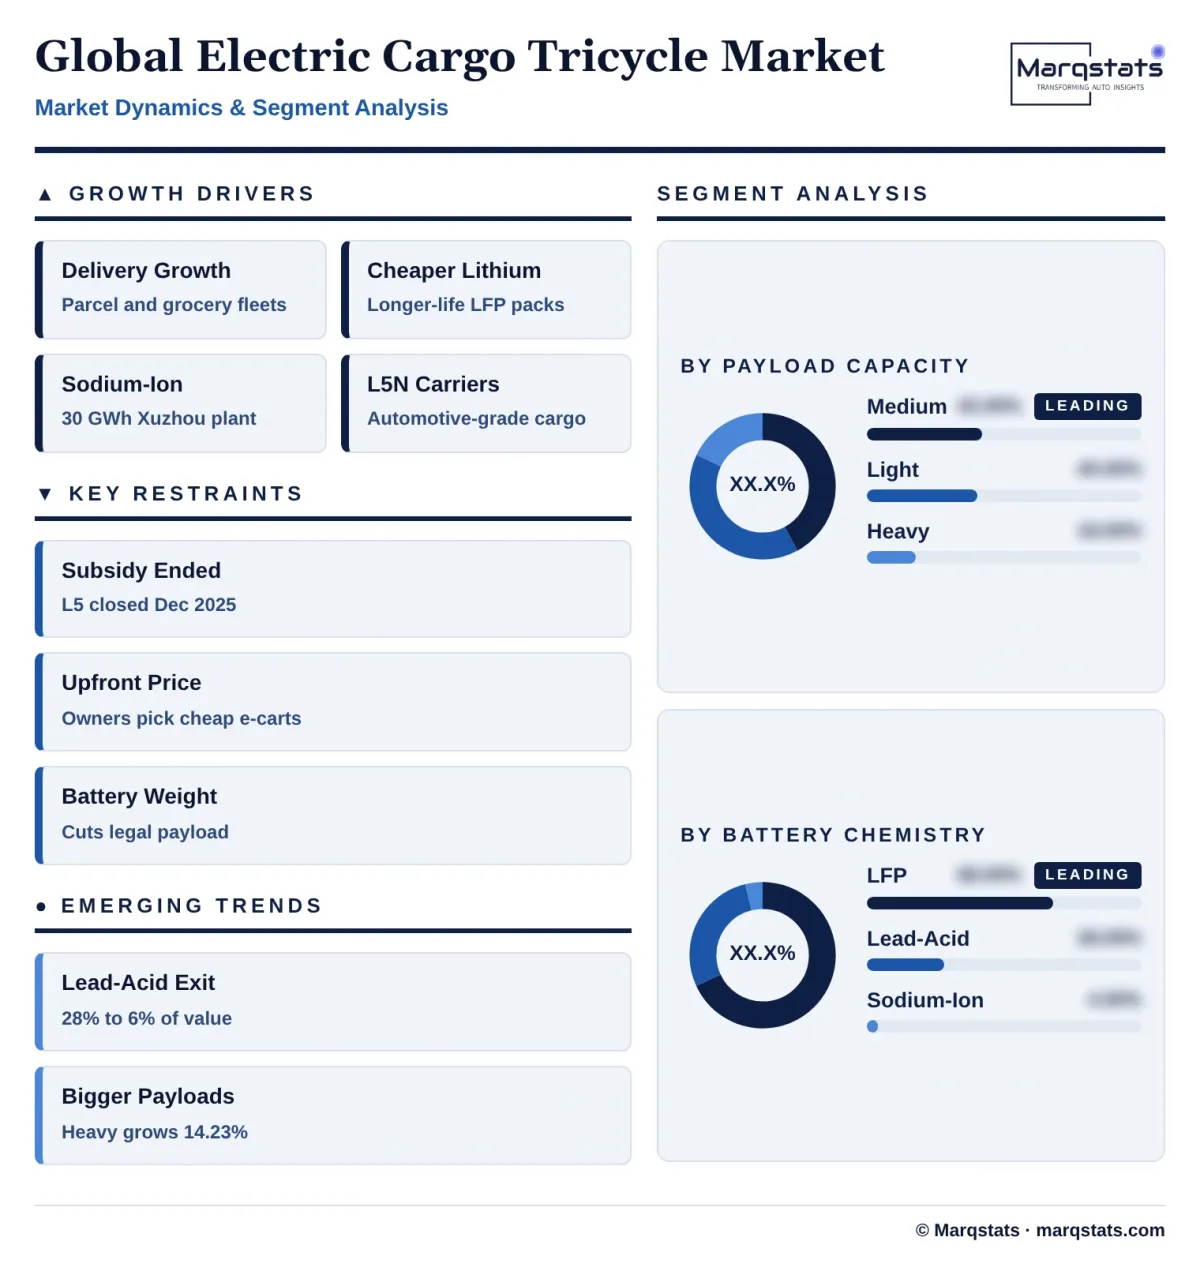
- Subsidies have ended for L5 vehicles. India's PM E-DRIVE support for L5 three-wheelers closed after 26 December 2025 once its target was met, raising the effective price of goods carriers for owner-operators.
- Upfront price still matters. Independent owner-drivers often choose cheaper, low-speed e-carts that do not need a commercial licence, even though L5N vehicles cost less to run over several years.
- Batteries reduce payload. A lithium pack of around 10 kWh adds more than 100 kg to an L5N vehicle, cutting legal payload within the weight limit and reducing the fuel savings per tonne carried.
- Type approval is costly in Europe. Certifying a new L5e-B commercial tricycle costs a manufacturer hundreds of thousands of euros, which limits the number of models and keeps prices high.
Key Trends
Four shifts are changing how electric cargo tricycles are built, powered and sold.
- Lead-acid is giving way to lithium and sodium-ion. Manufacturers are replacing lead-acid packs with lithium iron phosphate and, increasingly, sodium-ion batteries that last longer and charge faster.
- Vehicles are getting bigger. Delivery firms are choosing larger cargo boxes and higher payloads to cut the number of trips, lifting demand for medium and heavy cargo tricycles.
- Fleets buy services, not just vehicles. Battery swapping, leasing and subscription models let fleet operators avoid upfront battery costs and reduce downtime.
- Telematics is becoming standard. Goods carriers now come with GPS tracking, remote diagnostics and fleet software, letting operators manage routes, charging and maintenance centrally.
Strategic Implications
- For Chinese manufacturers, growth lies in exports and premium models. With domestic volume growing slowly, Jinpeng, Huaihai and other groups can expand by exporting to Latin America, Africa and Southeast Asia and by selling lithium and sodium-ion models at higher prices.
- For Indian manufacturers, financing and uptime decide sales. With central subsidies for L5 vehicles closed, partnerships with lenders, battery swapping networks and strong service coverage help owner-operators afford automotive-grade goods carriers.
- For battery makers, sodium-ion is an opening. Suppliers that can offer low-cost, cold-tolerant sodium-ion packs sized for three-wheelers can win share from lead-acid in China and in export markets.
- For delivery fleets, total cost of ownership should guide purchases. L5N goods carriers cost more upfront than e-carts but carry more, travel faster and last longer, and Marqstats estimates they reach cost parity with CNG vehicles at higher daily distances.
- For European cities, curb access and micro-hubs matter. Dedicated loading space and small urban depots make electric cargo tricycles practical for the last few hundred metres of parcel delivery.
Market Segmentation
Medium-payload vehicles account for an estimated 42.00% of 2025 value, USD 2,230.23 million, and about 35% of deliveries, rising to USD 3,718.00 million and 44.00% of value by 2030, a 10.76% CAGR. Indian L5N goods carriers such as the Mahindra Treo Zor and TVS King Kargo HD EV and larger Chinese express tricycles lead this segment.
Light-payload vehicles account for 40.00% of 2025 value, USD 2,124.04 million, and about 55% of deliveries, growing at 6.23% a year to USD 2,873.00 million and 34.00% of value by 2030, as couriers move to larger cargo boxes.
Heavy cargo and municipal utility tricycles account for 18.00% of 2025 value, USD 955.82 million, and grow fastest, at 14.23% a year, to USD 1,859.00 million and 22.00% of value by 2030, supported by sanitation fleets, distributors and rural transport.
Lithium iron phosphate batteries account for 68.00% of 2025 value, USD 3,610.86 million, rising to USD 6,253.00 million and 74.00% of value by 2030, an 11.61% CAGR, as fleets choose packs that last more than 2,000 cycles.
Lead-acid batteries account for 28.00% of 2025 value, USD 1,486.83 million, and fall 19.36% a year to USD 507.00 million and 6.00% of value by 2030, as their short life and recycling rules push buyers to lithium and sodium-ion.
Sodium-ion batteries account for 4.00% of 2025 value, USD 212.40 million, and grow at 51.41% a year to USD 1,690.00 million and 20.00% of value by 2030, supported by low material costs and better cold-weather performance.
Parcel and express delivery accounts for 47.00% of 2025 value, USD 2,495.75 million, rising to USD 4,140.50 million and 49.00% of value by 2030, a 10.65% CAGR, led by postal and express networks in China and e-commerce fleets in India.
Grocery and quick-commerce delivery accounts for 25.00% of 2025 value, USD 1,327.52 million, and grows fastest, at 12.25% a year, to USD 2,366.00 million and 28.00% of value by 2030, as retailers open more local fulfilment hubs.
Municipal sanitation and utility vehicles account for 14.00% of 2025 value, USD 743.41 million, rising to USD 1,098.50 million by 2030, an 8.12% CAGR.
Agricultural and rural cargo tricycles account for 14.00% of 2025 value, USD 743.41 million, growing slowly at 2.59% a year to USD 845.00 million and 10.00% of value by 2030.
By Geography
China
China is the largest market, with an estimated 88.88% of 2025 value, USD 4,719.53 million, and about 6.6 million deliveries at an average ex-factory price of about RMB 5,120. Value rises to USD 6,421.50 million by 2030, a 6.35% CAGR, while the share falls to 75.99% as prices ease in a mature market. Production is concentrated in Jiangsu, Henan and Shandong, led by Jinpeng, Huaihai and Zongshen, and demand comes from express delivery networks, retailers, farmers and municipal fleets. National standards for express delivery tricycles and local registration rules are pushing out small workshop assemblers.
India
India accounts for an estimated 5.04% of 2025 value, USD 267.70 million, from about 83,400 L3 e-carts at around INR 1.45 lakh and about 29,500 L5N goods carriers at around INR 3.55 lakh ex-factory. It grows fastest, at 38.92% a year, to USD 1,385.00 million and 16.39% of value by 2030 on about 590,000 deliveries, as e-commerce, quick-commerce and distribution fleets adopt L5N goods carriers. Mahindra, Bajaj, Omega Seiki, Euler, TVS and Altigreen lead L5N goods, and J.S. Auto and other assemblers lead e-carts. Delhi, Karnataka and Tamil Nadu account for a large share of L5N goods registrations.
Europe
Europe accounts for an estimated 2.56% of 2025 value, USD 135.86 million, from about 18,500 L2e-U and L5e-B utility tricycles at around EUR 6,800 ex-factory, rising to USD 315.00 million and 3.73% of value by 2030, an 18.32% CAGR. Postal operators, parcel carriers and municipal fleets in Germany, France, the Netherlands, Switzerland and the United Kingdom are the main buyers, using vehicles such as the Kyburz DXP and Piaggio Ape electric models for urban delivery in low-emission zones.
Rest of World
Latin America, Southeast Asia, the Middle East and Africa account for an estimated 3.52% of 2025 value, USD 187.00 million, from about 220,000 vehicles, rising to USD 328.50 million and 3.89% of value by 2030, an 11.93% CAGR. Imports and local assembly of Chinese and Indian vehicles serve delivery and market traders in Mexico, Colombia, Brazil, Egypt, Kenya and Nigeria.
How Competition Is Evolving
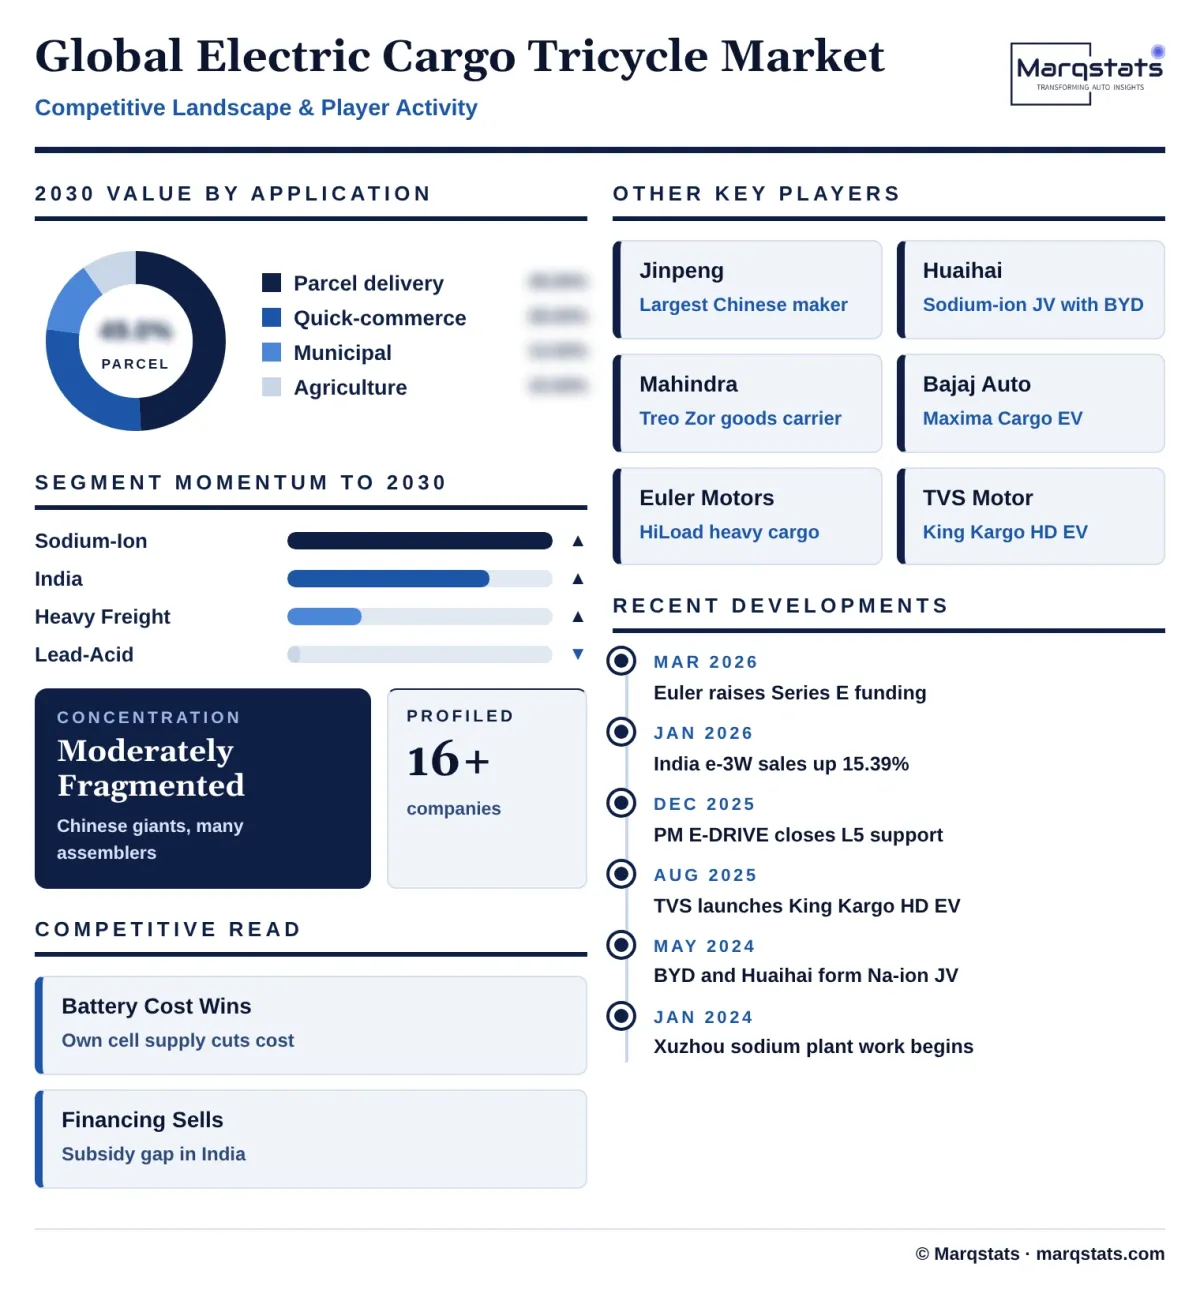
The electric cargo tricycle market is moderately fragmented. Chinese groups such as Jiangsu Jinpeng and Huaihai, including its Zongshen-linked brands, produce well over a million cargo tricycles a year each and dominate global volume, while hundreds of smaller Chinese and Indian assemblers serve local markets.
In India, the automotive-grade L5N goods segment is led by established vehicle makers. Mahindra Last Mile Mobility sold 95,874 electric three-wheelers of all types in calendar 2025 and Bajaj Auto 78,546, up 87%, and both are leaders in goods carriers alongside Omega Seiki, Euler Motors, Altigreen and TVS, which entered the electric cargo segment in August 2025.
In Europe, a small number of specialists such as Kyburz and Piaggio serve postal and city logistics fleets, where safety certification, durability and service support matter more than price.
Competition will be decided by battery cost, financing and service. Manufacturers with their own battery supply, such as Huaihai through its sodium-ion joint venture with BYD, and those offering financing, battery swapping and fleet telematics will gain share as buyers move from price to total cost of ownership.
Supply chains are localising. India's phased manufacturing rules for electric vehicle incentives pushed makers to source motors, controllers and battery packs locally, and specialist pack assemblers now build lithium packs for three-wheelers in India. In China, the largest groups make their own frames, bodies and paint lines and buy batteries from suppliers such as Tianneng and Chaowei, while Huaihai is securing sodium-ion supply through its BYD joint venture. These supply links let leading manufacturers cut costs faster than small assemblers that buy complete packs on the open market.
Companies Covered
Companies covered in the report include:
Recent Market Activity
Table of Contents
Coverage & Segmentation
The study covers the global electric cargo tricycle market, with 2025 as the base year, 2021 – 2025 as the historical period and 2026 – 2030 as the forecast period. Values are in US dollars at ex-factory wholesale prices, excluding taxes, subsidies and dealer margins, converted at 2025 average rates of RMB 7.16, INR 84.30 and USD 1.08 per euro. Volumes are annual deliveries of new vehicles. The market is segmented by payload capacity, battery chemistry, application and region.
Passenger three-wheelers and e-rickshaws, pedal-powered cargo bikes, two-wheeled delivery scooters, electric quadricycles and four-wheeled micro-trucks are excluded. Payload, chemistry, application and regional value splits are Marqstats estimates built on registration and sales data, manufacturer disclosures, battery and vehicle price benchmarks and trade data.