Market Snapshot
Key Takeaways
Market Overview & Analysis
Report Summary
The car wash services market comprises professional and informal operators cleaning four-wheel vehicles across four service formats — tunnel/conveyor, in-bay automatic (roll-over), self-service, and manual or hand wash — monetized through pay-per-wash and subscription plans. The 2025 global market of USD 51.70 billion aggregates North America (USD 23.11 billion), Asia-Pacific (USD 15.14 billion), Europe (USD 9.43 billion), the Middle East & Africa (USD 2.56 billion), and South America (USD 1.46 billion), and is projected to add more than USD 13 billion of annual revenue by 2030.
The market has expanded from USD 43.10 billion in 2021 to USD 51.70 billion in 2025. Growth dipped to about 2.7% in 2022 as euro, sterling, and emerging-currency depreciation compressed dollar-stated values, then accelerated to 5.5% in 2023 on post-pandemic recovery and pricing, and eases gradually from about 4.9% in 2026 to 4.4% by 2030 as developed markets mature. Regional shares shift slowly across the decade: North America holds near 44.7%, Asia-Pacific rises from 29.3% toward 29.9%, Europe eases from 18.2% toward 17.4%, the Middle East & Africa edges up to 5.1%, and South America holds near 2.8%.
The world's ten largest country markets in 2025 are the United States (USD 20.59 billion), China (USD 9.61 billion), Germany (USD 2.25 billion), Japan (USD 1.68 billion), the United Kingdom (USD 1.62 billion), Canada (USD 1.50 billion), France (USD 1.46 billion), Italy (USD 1.23 billion), Brazil (USD 1.04 billion), and Mexico (USD 1.02 billion). The fastest-growing country markets are India at a 7.52% CAGR, the United Arab Emirates at 5.90%, Mexico at 5.60%, China at 5.52%, and Saudi Arabia at 5.48%, while Japan is the slowest at 2.36%, reflecting a shrinking parc and mature demand. The growth ranking maps directly onto formalization stage: markets converting informal washing into organized capacity grow roughly twice as fast as mature markets growing on pricing alone.
Format structures diverge sharply by region, making the global market two-pole. North America is tunnel-led: express-exterior conveyor washing with unlimited-wash memberships defines the United States, the world's most automated and subscription-driven market. Europe is in-bay-automatic-led, with roll-overs at about 32% of major-market revenue, self-service at 20%, and fuel-station forecourts hosting the largest site share. Asia-Pacific, South America, and the Middle East & Africa are manual-led — at roughly 50%, 68%, and 59% of modeled revenue respectively — spanning China's wash-and-beauty shops, India's informal washing, Brazil's lava-rapido, and Gulf station washing. Together, manual/hand-wash and tunnel/conveyor form the two largest global service blocs, each near 30% of worldwide revenue.
Wash intensity — annual professional-wash spending per vehicle in operation — falls along a steep global gradient that maps formalization headroom. The United Arab Emirates leads the world at about USD 117 per vehicle (roughly 178% of the United States level), followed by the United States near USD 66, Saudi Arabia at USD 52, Germany at USD 40, the United Kingdom at USD 38, France at USD 31, China at USD 25, Brazil at USD 21, Japan at USD 20, South Africa at USD 16, and India at USD 10. Emerging markets wash frequently yet cheaply; developed markets wash less often at far higher tickets. Closing even part of this gap through formalization, automation, and rising tickets underpins most of the market's long-term growth.
Payment models are converging on recurring revenue from opposite directions. In North America, unlimited-wash subscriptions built the modern express-tunnel industry. In China, prepaid stored-value cards and app memberships reach about 29% of national revenue — the highest of any major market — rising toward 38% by 2030. In the Gulf, the United Arab Emirates carries the highest subscription penetration of any market at about 17%, and in Europe, German Waschflatrate programs and United Kingdom automated operators grow subscriptions near 13% annually from an 8% base. Across every region, converting high-frequency washing into membership revenue is the industry's central monetization strategy.
Water regulation is the industry's defining external force. Germany restricts home car washing outright, lifting professional penetration to about 78%; Nordic municipalities restrict driveway washing; Saudi municipalities began mandating a transition from manual to automatic washing at fuel stations in 2026; northern Chinese cities impose recycled-water requirements; and Gulf operators deploy steam washing that uses a few litres per vehicle versus more than 100 for traditional methods. Regulation increasingly determines format economics, favouring automated, water-recycling, and waterless operators worldwide. A traditional wash consumes 100 to 150 litres of potable water, so as water stress spreads from the Gulf and northern China to Indian and Latin American cities — Bengaluru banned potable-water car washing during its 2024 drought — the compliance advantage of recycling, steam, and waterless systems compounds across every region.
Market Dynamics
Key Drivers
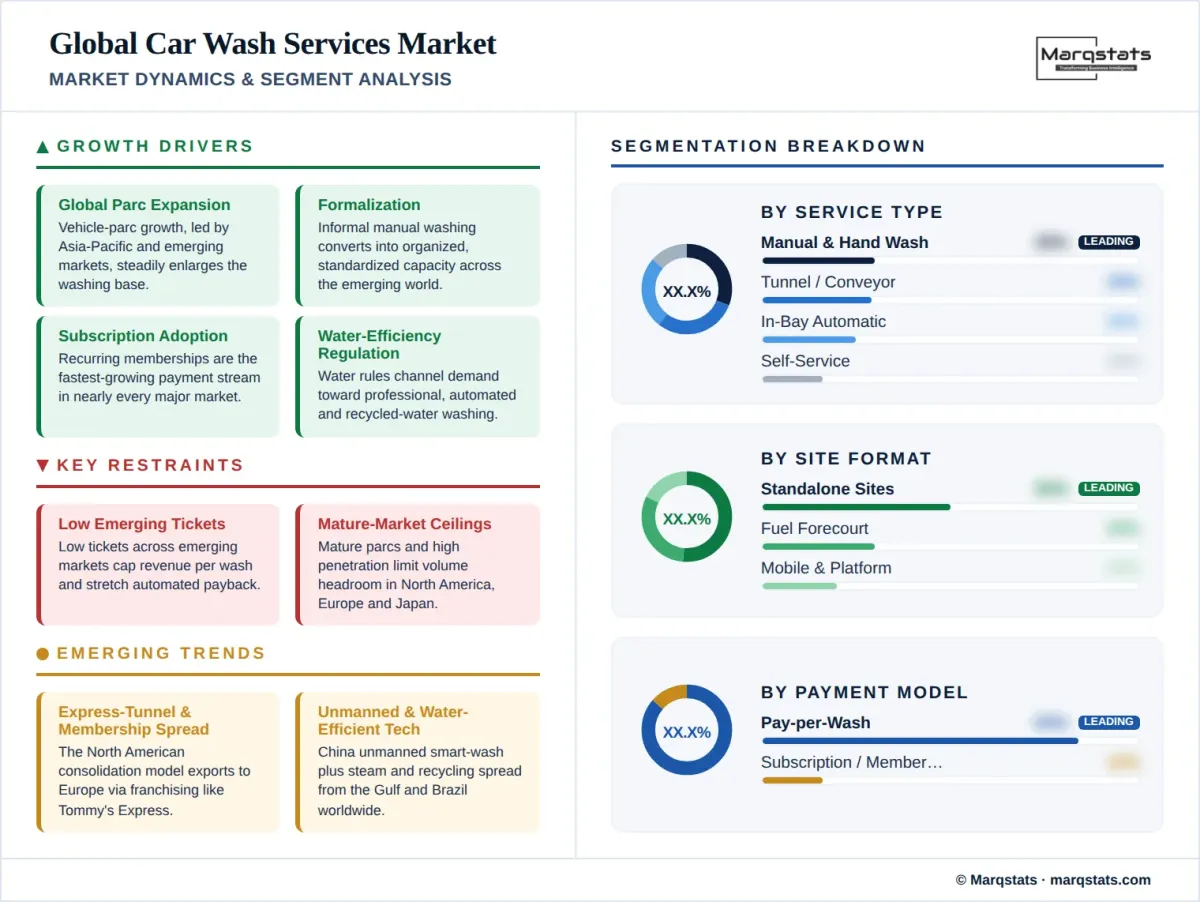
- Global vehicle-parc expansion, led by Asia-Pacific and emerging markets, steadily enlarges the addressable washing base.
- Formalization converts informal manual washing into organized, standardized capacity across emerging regions.
- Subscription and membership adoption converts episodic demand into recurring revenue in every major market.
- Water-efficiency regulation channels demand toward professional, automated, and recycled-water washing.
- Fuel retailers worldwide expand forecourt washing as non-fuel revenue, from ADNOC and Sinopec to Aral and YPF.
- Premiumization toward express tunnels and touchless formats lifts tickets across developed and Gulf markets.
Key Restraints
- Low tickets across emerging markets cap revenue per wash and stretch automated-equipment payback.
- Mature parcs and high penetration limit volume headroom across North America, Europe, and Japan.
- Large informal bases constrain standards, water compliance, and pricing power across emerging regions.
- Currency depreciation in non-pegged emerging markets weighs on dollar-denominated market value.
Key Trends
- Express-tunnel and membership consolidation advances in North America and expands into Europe through franchising.
- Unmanned and app-based smart washing scales in China, with three-minute washes at a fraction of traditional water use.
- Steam, waterless, and water-recycling methods spread from the Gulf and Brazil across water-scarce markets.
- Fuel retailers convert manual forecourt washing to automated systems under regulation and cost pressure.
Market Segmentation
Manual and hand-wash formats form the largest global service bloc, near 30% of worldwide revenue, dominating Asia-Pacific at about 50% of modeled revenue, South America at 68%, and the Middle East & Africa at 59%. The bloc spans China's wash-and-beauty shops (USD 5.75 billion), the United Kingdom's hand car washes (about 68% of national revenue), India's overwhelmingly informal sector (about 88%), Brazil's lava-rapido, and Gulf station washing. The global share declines gradually as automation, regulation, and formalization advance, yet manual washing remains the emerging world's structural core, sustained by low labour costs and hand-wash preference. Its upper tier formalizes through franchising, steam and ecological methods, and platform ratings rather than disappearing.
Tunnel/conveyor washing forms the second global bloc, also near 30% of worldwide revenue, concentrated in North America, where express-exterior tunnels with unlimited memberships dominate the United States, the world's largest market. Outside North America, tunnels hold about 22% of European major-market revenue — led by German Waschstrassen processing over 500,000 cars per year — about 21% in the United Arab Emirates on ADNOC's high-capacity rollout, and about 11% in China, rising fastest of any Chinese format. Tunnels are the fastest-growing automated format in most regions, capturing the bulk of new organized investment on throughput and membership economics, and franchise systems such as Tommy's Express now carry the express model from North America into Europe and beyond.
In-bay automatic roll-overs are the world's most widespread automated format and Europe's largest, at about 32% of European major-market revenue anchored by Germany's roughly 14,000 Portalanlagen. Roll-overs lead Japan at about 62% of national revenue — the world's most machine-led market — hold about 25% in China, 22% in the Middle East & Africa, and anchor forecourt washing on every continent. Compact footprints and falling equipment costs make roll-overs the default automation step for fuel stations and mid-density sites worldwide, and the format is the primary beneficiary of manual-to-automatic conversion mandates such as Saudi Arabia's.
Self-service bays hold their largest shares in Europe — about 20% of major-market revenue, led by France's haute-pression culture at 37% of national revenue, Spain's boxes at 32%, and Poland's dense BKF-built sector — with smaller weightings across North America, Japan's coin washes, and emerging markets. The format serves cost-conscious users and enthusiasts globally, and increasingly adds cashless, app-based payment. Its economics — low labour, modest land, durable equipment — keep it resilient wherever attended washing is expensive, while cheap manual labour limits it across the emerging world.
Standalone sites form the largest global site channel, spanning United States express-tunnel sites, China's wash-and-beauty shops (about 60% of national revenue), European full-service centres, United Kingdom hand-car-wash lots, and Latin American lava-rapido. The channel consolidates gradually around branded chains, franchises, and platform-rated stores as organized capacity expands worldwide, and it supports the strongest subscription and premiumization economics of any site format.
Forecourt washing is the world's most consistent organized channel, holding about 43% of European major-market revenue, 39% in the Middle East & Africa — the highest regional share — and about 22% in China on Sinopec's roughly 30,000-station network. Fuel retailers on every continent — Aral, Shell, TotalEnergies, Eni, and Repsol in Europe; ADNOC, ENOC, SASCO, and Aldrees in the Gulf; Engen in Africa; YPF, Petrobras-branded stations, and Copec in South America; and ENEOS in Japan — treat washing as core non-fuel revenue bundled with fuel and convenience retail.
Mobile, parking-lot, and platform formats are the most technology-driven channel, led by China's unmanned smart-wash stations and O2O platform services, Gulf app-based on-demand washing including Careem's Ezhalha and CAFU, India's doorstep services, and Brazil's mobile ecological washing. The channel gains share globally as convenience-oriented and app-booked demand expands, and low-water mobile methods make it the natural entry format in water-stressed, high-density cities.
Single-visit payment remains the global default, spanning walk-up demand at forecourts, self-service bays, hand washes, and independent shops worldwide. Its share declines steadily in every major market as subscriptions expand, with cashless and app-based payment now near universal across organized formats from WeChat Pay and Alipay in China to Pix in Brazil. Digital payment itself is a formalization force, improving revenue visibility across historically cash-based sectors and enabling small operators to offer memberships for the first time.
Subscription and membership plans are the fastest-growing revenue stream worldwide. China leads major markets at about 29% of national revenue (USD 2.80 billion), rising toward 38%; the United Arab Emirates carries the highest penetration of any market at about 17%, rising toward 24%; North American unlimited-wash memberships anchor the express-tunnel model; and European subscriptions grow near 13% annually from an 8% base. Recurring plans also serve mobility-as-a-service fleets and ride-hailing operators, whose platform cleanliness standards sustain contracted high-frequency washing across every region.
Passenger vehicles generate roughly nine-tenths of global revenue, reflecting household demand across all regions, with national shares between about 85% and 92%. Rising electric-vehicle ownership adds demand for sensor-safe, touch-free washing, most visibly in China, where the new energy vehicle parc exceeded 31 million by the end of 2024, and increasingly across Europe and North America as camera- and sensor-laden vehicles require gentler wash processes.
Commercial washing holds roughly one-tenth of global revenue and grows faster than passenger washing in every region, driven by logistics, delivery, and ride-hailing fleets. Commercial shares are highest in South America and Saudi Arabia at about 15%, and fleet contracts are an increasingly organized revenue source from Shenzhen's electrified ride-hailing fleets to European bus and truck wash systems supplied by makers such as Otto Christ. Last-mile delivery growth worldwide adds a structural tailwind, as platform presentation standards keep commercial washing frequent and contracted.
By Geography
North America
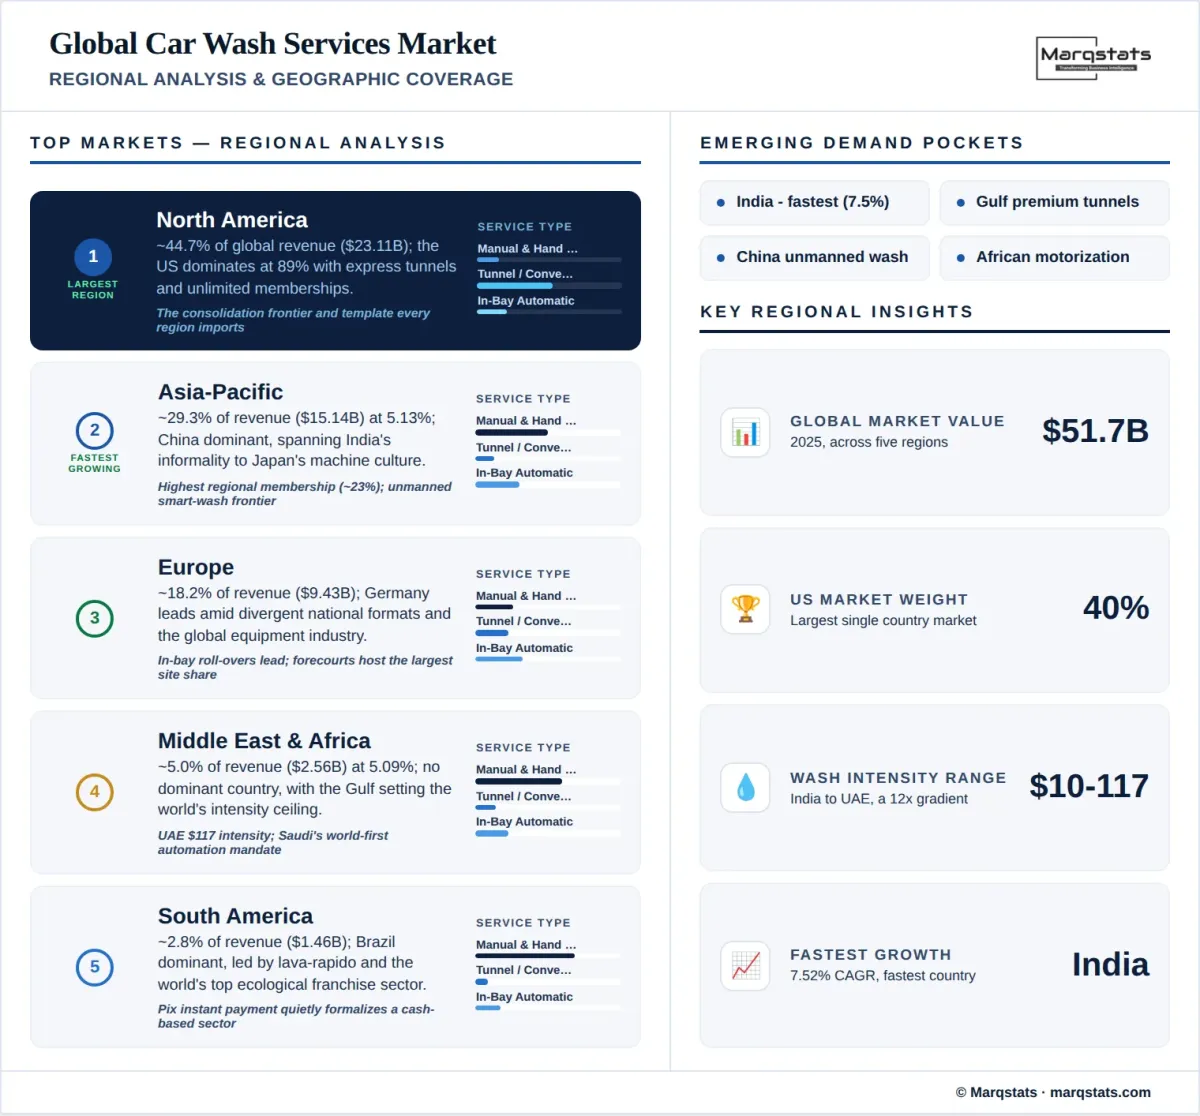
North America is the world's largest regional market, contributing USD 23.11 billion, or 44.7% of 2025 global revenue, and growing at a 4.72% CAGR to USD 29.11 billion by 2030. The United States dominates at 89.1% of regional revenue, with Canada at 6.5% and Mexico at 4.4%. The region defines the modern industry model: express-exterior tunnels, unlimited-wash memberships, and rapid chain consolidation led by Mister Car Wash, Driven Brands' Take 5, ZIPS, Quick Quack, and Tommy's Express. Mexico is the region's fastest-growing market at a 5.60% CAGR, formalizing from an informal autolavado base, while United States wash intensity near USD 66 per vehicle anchors the global benchmark. Private-equity investment and real-estate-backed development pipelines keep North America the industry's consolidation frontier, and its membership model is the template every other region is now importing.
Asia-Pacific
Asia-Pacific is the second-largest and fastest-growing region, contributing USD 15.14 billion, or 29.3% of 2025 global revenue, at a 5.13% CAGR to USD 19.44 billion by 2030. China dominates at 63.5% of regional revenue, the world's second-largest market, where wash-and-beauty shops meet the fastest automation shift anywhere — unmanned three-minute smart washes, O2O platforms Tuhu and Tmall Yangche, and the world's deepest membership culture at 29% of revenue. India is the world's fastest-growing market at 7.52% on an 88%-informal base, and Japan the slowest at 2.36%, the world's most machine-led market with drive-through machines at about 62% of revenue. The region spans the industry's full development spectrum in a single geography — from Bengaluru's water-driven doorstep washing to Tokyo's coin-operated machine culture — and its membership penetration of roughly 23% is the highest of any region.
Europe
Europe contributes USD 9.43 billion, or 18.2% of 2025 global revenue, growing at a 3.66% CAGR to USD 11.29 billion by 2030. Germany leads at 23.9% of regional revenue, ahead of the United Kingdom at 17.2%, France at 15.5%, Italy at 13.0%, and Spain at 8.7%. National formats diverge within the region — German Portalanlagen under home-wash bans, United Kingdom hand car washes under labour-standards enforcement, French and Spanish self-service, Italian autolavaggi — while Europe anchors the global equipment industry through WashTec, the world's largest wash-equipment maker, alongside Otto Christ, Karcher, and Istobal. IMO Car Wash, with over 700 European sites, changed ownership in a EUR 411 million transaction completed in early 2026, and the Rest of Europe — spanning Poland's dense self-service sector and the high-intensity, driveway-restricted Nordics — is the region's fastest-growing component at a 4.60% CAGR.
South America
South America is the smallest region, contributing USD 1.46 billion, or 2.8% of 2025 global revenue, growing at a 4.42% CAGR to USD 1.81 billion by 2030. Brazil dominates at 71.4% of regional revenue and grows fastest at 4.60%, anchored by lava-rapido washing and the world's most developed ecological franchise sector, led by Acquazero and DryWash, whose waterless models export internationally. Argentina channels about 30% of washing through YPF forecourts under macroeconomic pressure, and the Andean markets formalize gradually from ultra-low tickets. Brazil's Pix instant-payment rail has become a quiet formalization engine, letting small operators accept cashless payment and subscription billing across a historically cash-based sector.
Middle East & Africa
The Middle East & Africa contributes USD 2.56 billion, or 5.0% of 2025 global revenue, growing at a 5.09% CAGR to USD 3.29 billion by 2030 — the second-fastest region. It is the only region without a dominant country: the Rest of MEA holds 45.9%, Saudi Arabia 27.4%, the United Arab Emirates 18.1%, and South Africa 8.6%. The Gulf sets the direction with the world's highest wash intensities and subscription rates, ADNOC's tunnel rollout, Petromin's eco-steam washing, and Saudi Arabia's 2026 fuel-station automation mandate — the world's only regulation actively phasing manual washing out. Dust-driven wash frequencies of 20 to 24 washes per vehicle each year, the highest anywhere, make the Gulf the world's most intensive washing environment and its proving ground for water-efficient technology.
How Competition Is Evolving
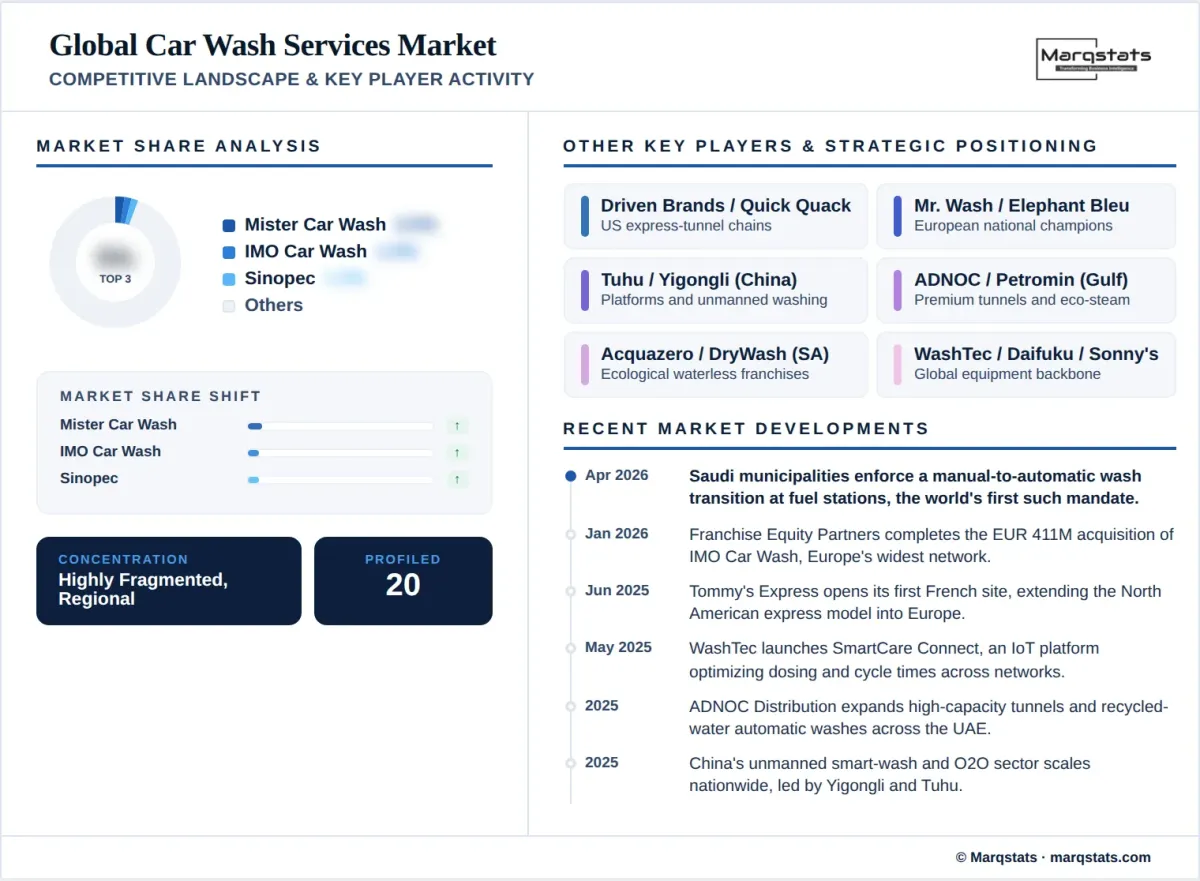
The global car wash services market is highly fragmented, with no operator holding a material worldwide share and competitive structures differing fundamentally by region. North America hosts the largest chains — Mister Car Wash with 500-plus locations, Driven Brands' Take 5 Car Wash, ZIPS, Quick Quack, and franchise network Tommy's Express — competing on express-tunnel density and unlimited-membership economics. Europe's widest network is IMO Car Wash Group with over 700 sites, alongside national champions Mr. Wash in Germany and Elephant Bleu in France.
Across Asia and the emerging world, organization happens through platforms and fuel retailers rather than chain ownership. China's Tuhu, Tmall Yangche, and Yigongli organize hundreds of thousands of independent shops and unmanned stations; Sinopec and PetroChina operate the world's largest forecourt networks; ADNOC Distribution anchors the Gulf's premium tunnel and membership model; Petromin, SASCO, and Careem's Ezhalha formalize Saudi washing; and Acquazero and DryWash franchise ecological washing from Brazil. Fuel retailers on every continent — from Aral, Shell, and TotalEnergies to YPF, Engen, and ENEOS — make forecourts the world's most consistent organized channel.
The equipment tier is globally concentrated where operations are fragmented. WashTec of Germany, the world's largest wash-equipment manufacturer, together with Daifuku of Japan, Sonny's Enterprises of the United States, Otto Christ, Karcher, Istobal, and China's Autobase and Shinewash, supplies the technology backbone across all regions and accelerates IoT site management, water reclamation, and touchless systems. Competition worldwide increasingly turns on subscription penetration, water efficiency, automation economics, and platform reach, with consolidation advancing fastest in North America and regulation-driven formalization reshaping the Gulf, China, and Latin America through 2030.
Companies Covered
The report profiles 20++ companies with full strategy and financials analysis, including:
Recent Market Activity
Table of Contents
Coverage & Segmentation
This report provides a comprehensive analysis of the global car wash services market covering the historical period 2021 to 2025 and the forecast period 2026 to 2030, with 2025 as the base year. The study aggregates five regional markets — North America, Europe, Asia-Pacific, South America, and the Middle East & Africa — built from 18 modeled countries and four Rest-of regions, defining the market as annual revenue earned by professional and informal operators cleaning four-wheel vehicles through tunnel/conveyor, in-bay automatic, self-service, and manual formats, inclusive of basic interior cleaning; full detailing and equipment or chemical sales are excluded. Market size is presented in value terms (USD), with historical figures reflecting exchange-rate effects and forecasts assuming constant exchange rates.
The study segments the market by service type, site format, payment model, and vehicle type, and examines regional and country demand, format divergence, wash-intensity economics, subscription adoption, water regulation, and competition across all five regions. Market sizing aggregates bottom-up country models anchored to national vehicle-registration and statistical authorities, cross-checked against wash intensity per vehicle spanning USD 10 to USD 117. The competitive section profiles 20 chains, platforms, fuel retailers, and equipment makers spanning every region.