Statistics & Highlights

Market Snapshot

Market size in USD Billion
$2.56B
2025
Base year
$2.69B
2026
Estimated
  
$3.29B
2030
Forecast
Largest market
Saudi Arabia
Fastest growing
United Arab Emirates
Dominant segment
Manual / Hand Wash
Concentration
Fragmented
CAGR
5.09%
2026 – 2030
GROWTH
+$0.73B
Absolute
STUDY PARAMETERS
Base year2025
Historical period2021 – 2025
Forecast period2026 – 2030
Units consideredValue (USD BN)
REPORT COVERAGE
Segments covered4 segments
Regions covered4 regions
Companies profiled18++
Report pages300+
DeliverablesPDF, Excel, PPT
Executive Summary

Key Takeaways

Middle East & Africa car wash services market valued at USD 2.56 billion in 2025, projected to reach USD 3.29 billion by 2030 at a 5.09% CAGR.
No single country dominates: Rest of MEA holds 45.9%, Saudi Arabia 27.4%, the UAE 18.1%, and South Africa 8.6% of 2025 revenue.
The UAE has the highest wash intensity of any market worldwide at about USD 117 per vehicle, roughly 178% of the United States level, on dust-driven frequency of about 24 washes per vehicle each year.
Manual and hand-wash formats form the largest service type at about 59% of modeled-market revenue, with tunnels a notable 14%.
The UAE carries the highest subscription penetration of any market at about 17% of revenue, rising toward 24%, led by fuel-retailer memberships.
Gulf water scarcity drives the world's most advanced steam, waterless, and water-recycling washing, with Saudi Arabia mandating automation at fuel stations.
Market Insights

Market Overview & Analysis

Report Summary

The Middle East & Africa car wash services market comprises professional and informal operators cleaning four-wheel vehicles across four service formats — manual and hand wash, in-bay automatic (roll-over), tunnel/conveyor, and self-service — monetized through pay-per-wash and subscription plans. The 2025 market of USD 2.56 billion aggregates the Rest of Middle East & Africa (USD 1.18 billion), Saudi Arabia (USD 0.70 billion), the United Arab Emirates (USD 0.47 billion), and South Africa (USD 0.22 billion).

The region's defining feature is a Gulf-led premium tier atop a large, diverse emerging base. The United Arab Emirates and Saudi Arabia combine high dust-driven wash frequency, rising incomes, and rapid formalization under Vision 2030 and comparable national programs, producing the world's highest wash intensities and subscription rates. South Africa adds an established yet slower-growing market with a strong informal and forecourt structure, while the Rest of Middle East & Africa — spanning the wider Gulf, the Levant, North Africa, and Sub-Saharan Africa — is manual-dominated at low tickets across a very large aggregate parc.

Aggregated across the three modeled major markets, manual and hand wash holds the largest share at about 59% of 2025 revenue (USD 0.82 billion), followed by in-bay automatic at about 22% (USD 0.31 billion), tunnels at about 14% (USD 0.19 billion), and self-service at about 5% (USD 0.07 billion). The tunnel share is the second-highest of any region after North America, driven by the United Arab Emirates' premium high-capacity tunnel rollout. This makes the region more automated than South America despite a similar manual base, reflecting Gulf capital and water regulation accelerating the format shift.

The United Arab Emirates is the region's structural anomaly and the world's most intense car wash market. A small parc of roughly 3.5 million vehicles is washed about 24 times per year at premium tickets, producing wash intensity of about USD 117 per vehicle — roughly 178% of the United States level and the highest of any market in the world. Subscription penetration is also the highest of any market, near 17% of revenue and rising toward 24%, led by fuel-retailer memberships. ADNOC Distribution, the largest wash network, rolled out high-capacity tunnels and upgraded automatic facilities, anchoring the premium, membership-driven model.

Water scarcity is the region's unifying strategic force. Gulf markets face severe water deficits, and a traditional wash consumes over 100 litres, so steam, waterless, and water-recycling methods are more advanced here than anywhere else. Saudi Arabia has begun mandating a transition from manual to automatic washing at fuel stations, the United Arab Emirates pursues Net Zero 2050 with recycled-water automatic washes, and waterless services spread across Gulf cities. Wash intensity spans an unusually wide range — from about USD 117 in the United Arab Emirates and USD 52 in Saudi Arabia to USD 16 in South Africa and USD 15 across the Rest of Middle East & Africa — versus roughly USD 66 in the United States.

The region's structure sets it apart from every other in this series. It is the only region without a single dominant country, the only one where fuel-station forecourts form the largest site channel, and the only one pairing the world's highest wash intensities and subscription rates with a large, low-ticket emerging base. Its growth path depends on how fast Gulf water regulation and premiumization spread organized, water-efficient washing, how quickly African motorization lifts the wider region, and how far subscription models extend the Gulf's recurring-revenue template across the market through 2030.

Market Dynamics

Key Drivers

  • Dust-driven wash frequency across the Gulf, the highest in the world, sustains intense per-vehicle demand.
  • Vehicle-parc expansion across the Gulf and the wider region enlarges the addressable base.
  • Formalization under Vision 2030 and comparable national programs drives organized retail buildout and technology adoption.
  • Premiumization and subscription models, led by the United Arab Emirates, convert high frequency into recurring revenue.
  • Water-efficiency requirements favour steam, waterless, and water-recycling operators across the Gulf.
  • Fuel retailers, led by ADNOC, ENOC, SASCO, and Engen, invest in automated forecourt washing region-wide.

Key Restraints

  • Low tickets across the Rest of Middle East & Africa and South Africa cap revenue per wash despite high frequency.
  • Currency depreciation in non-pegged markets, including South Africa, weighs on dollar-denominated value.
  • Large informal bases across Africa and the wider region limit standards and pricing power.
  • Water and energy costs raise the operating burden for water-intensive formats in the Gulf.

Key Trends

  • High-capacity tunnels and recycled-water automatic washes expand in the United Arab Emirates, led by ADNOC.
  • Saudi Arabia enforces a shift from manual to automatic washing at fuel stations under water rules.
  • Subscription and app-based memberships spread from the Gulf across the region.
  • Steam and waterless washing scale across Gulf cities pursuing sustainability targets.
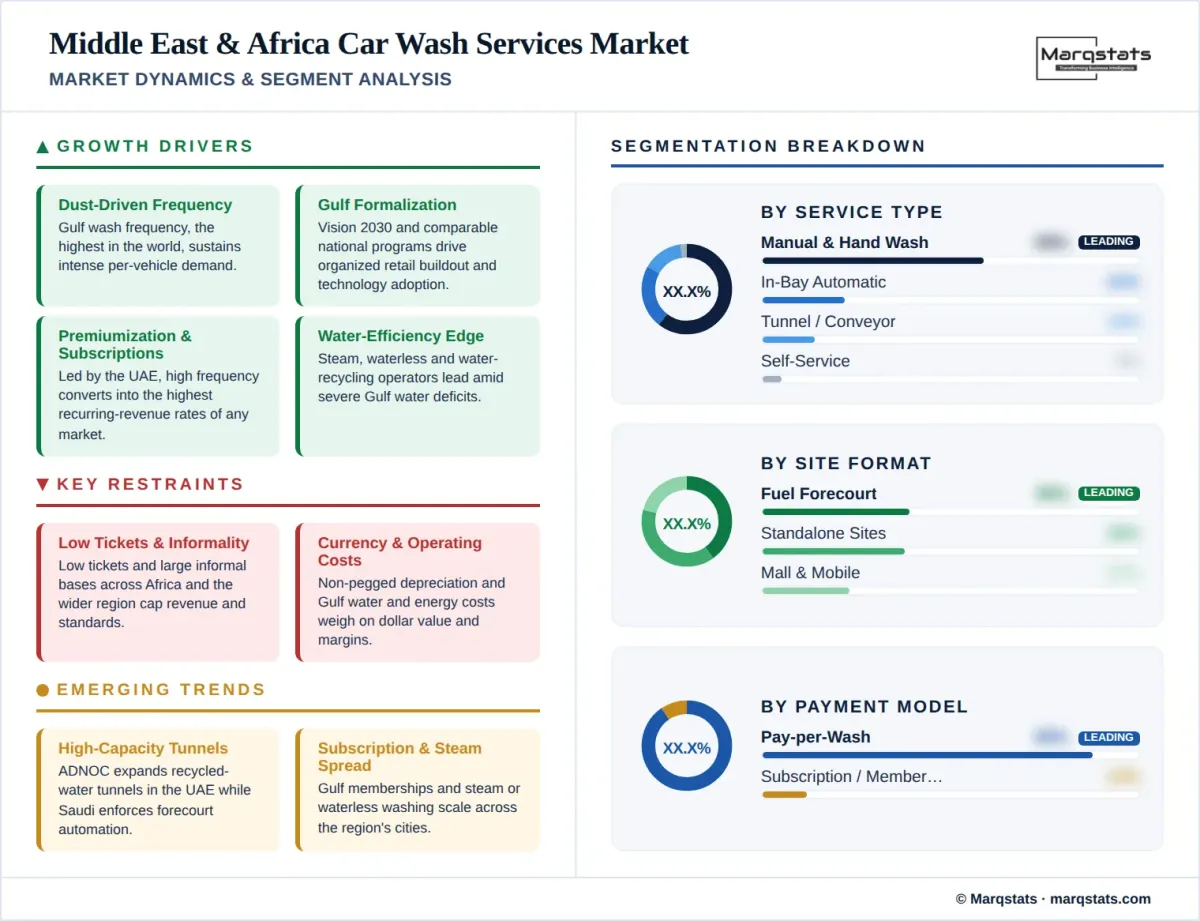
Middle East Africa Car Wash Services Market Market Dynamics Segment Analysis Infographic
Segment Analysis

Market Segmentation

Manual / Hand Wash
Leading

Manual and hand-wash formats hold the largest share at about 59% of 2025 modeled-market revenue, USD 0.82 billion, spanning premium mall and hand washing in the United Arab Emirates, station washing in Saudi Arabia, and informal and organized washing in South Africa. The regional share eases as Gulf automation mandates and premiumization advance, yet manual washing remains the region's structural core, sustained by labour availability and, in the Gulf, premium hand-wash positioning.

In-Bay Automatic (Roll-over)

In-bay automatic roll-overs hold about 22% of 2025 modeled-market revenue, USD 0.31 billion, the largest automated format. Machines concentrate at fuel-station forecourts across all three modeled markets, and gain share fastest in Saudi Arabia as municipal rules mandate automatic systems. Fuel retailers ADNOC, ENOC, SASCO, and Engen anchor adoption, increasingly with water-recycling integration.

Tunnel / Conveyor

Tunnel/conveyor washes hold about 14% of 2025 modeled-market revenue, USD 0.19 billion — the second-highest tunnel share of any region after North America. The United Arab Emirates leads at about 21% of national revenue and rising toward 24%, driven by ADNOC's high-capacity tunnel rollout, while Saudi and South African tunnels grow from smaller bases in premium metros.

Self-Service

Self-service bays hold about 5% of 2025 modeled-market revenue, USD 0.07 billion, growing steadily from a small base at fuel stations and standalone sites. South Africa carries the highest self-service weighting among the modeled markets, and the format serves cost-conscious users across the region.

Fuel-Station Forecourt
Leading

Forecourt washes hold about 39% of 2025 modeled-market revenue, USD 0.54 billion — the highest forecourt share of any region. Gulf and African fuel retailers — ADNOC and ENOC in the United Arab Emirates, SASCO and Aldrees in Saudi Arabia, and Engen and Astron in South Africa — operate extensive wash networks bundled with fuel and convenience retail, making forecourts the backbone of organized supply region-wide.

Standalone Dedicated Sites

Standalone dedicated sites hold about 38% of 2025 modeled-market revenue, USD 0.53 billion. Dedicated wash centres, steam-wash outlets, and premium hand-wash sites anchor the channel, with South Africa carrying the highest standalone weighting and the Gulf consolidating around branded, water-efficient formats.

Others (Mall Parking, Mobile)

Mall-parking and mobile formats hold about 23% of 2025 modeled-market revenue, USD 0.31 billion — among the highest of any region, led by the United Arab Emirates. Mall-based hand washing, app-based on-demand services, and mobile steam vans define this channel, reflecting the Gulf's mall-oriented, convenience-driven consumer culture.

Pay-per-Wash
Leading

Single-visit payment accounts for about 88% of 2025 modeled-market revenue, USD 1.23 billion, reflecting walk-up demand across forecourt, standalone, and informal formats. The share declines as subscriptions expand, supported by near-universal cashless payment across the Gulf and growing digital payment elsewhere.

Subscription / Membership

Subscription and membership reach about 12% of 2025 modeled-market revenue, USD 0.16 billion, driven by the United Arab Emirates at about 17% of national revenue — the highest of any market — and rising toward 24%. Fuel-retailer unlimited-wash plans and app memberships convert the Gulf's very high wash frequency into recurring revenue, a model that mobility-as-a-service fleets and ride-hailing operators increasingly adopt for predictable washing.

Passenger Cars
Leading

Passenger vehicles generate about 87% of 2025 modeled-market revenue, USD 1.21 billion, reflecting high car ownership and frequent cleaning in dusty climates. The share eases slightly as commercial washing grows faster across the region.

Commercial Vehicles (incl. Fleet)

Commercial washing holds about 13% of 2025 modeled-market revenue, USD 0.18 billion, rising through 2030. Logistics, delivery, and ride-hailing fleets sustain high-frequency washing across Gulf metros and African cities, with fleet contracts a growing organized revenue source.

Regional Analysis

By Geography

United Arab Emirates

The United Arab Emirates contributes USD 0.47 billion, or 18.1% of 2025 regional revenue, and is the fastest-growing major market at a 5.90% CAGR, reaching USD 0.62 billion by 2030. It is the world's most intense car wash market, with a small parc washed about 24 times per year at premium tickets producing wash intensity near USD 117 per vehicle. ADNOC Distribution operates the largest network, rolling out high-capacity tunnels and recycled-water automatic washes, and subscription penetration near 17% of revenue is the highest of any market. Mall-parking and mobile washing are especially prominent in Dubai and Abu Dhabi.

Saudi Arabia

Saudi Arabia contributes USD 0.70 billion, or 27.4% of 2025 regional revenue, growing at a 5.48% CAGR to USD 0.92 billion by 2030. Manual station washes hold about 64% of national revenue, though municipalities have begun mandating a transition from manual to automatic washing at fuel stations under water rules. Dust drives about 20 washes per vehicle each year, Vision 2030 accelerates formalization, and steam operators such as Petromin Express and fuel retailers SASCO and Aldrees anchor the organized layer.

South Africa

South Africa contributes USD 0.22 billion, or 8.6% of 2025 regional revenue, growing at a 4.00% CAGR to USD 0.27 billion by 2030 — the slowest of the modeled markets. Manual and mobile washing holds about 57% of national revenue, spanning informal and organized operators, while fuel retailers Engen, Astron, and Shell operate extensive forecourt washing. Currency effects weigh on dollar value, and washing across a parc of roughly 12.5 million vehicles remains resilient with a strong forecourt and standalone structure.

Rest of Middle East & Africa

The Rest of Middle East & Africa contributes USD 1.18 billion, or 45.9% of 2025 regional revenue — the largest bloc — growing at a 4.72% CAGR to USD 1.48 billion by 2030. Spanning the wider Gulf, the Levant, North Africa, and Sub-Saharan Africa, including Egypt, Nigeria, Kenya, Morocco, Kuwait, Qatar, and Oman, the market is manual-dominated at low tickets near USD 2.8 across a very large aggregate parc of roughly 70 million. Fuel retailers and emerging organized operators anchor formalization as motorization advances across Africa.
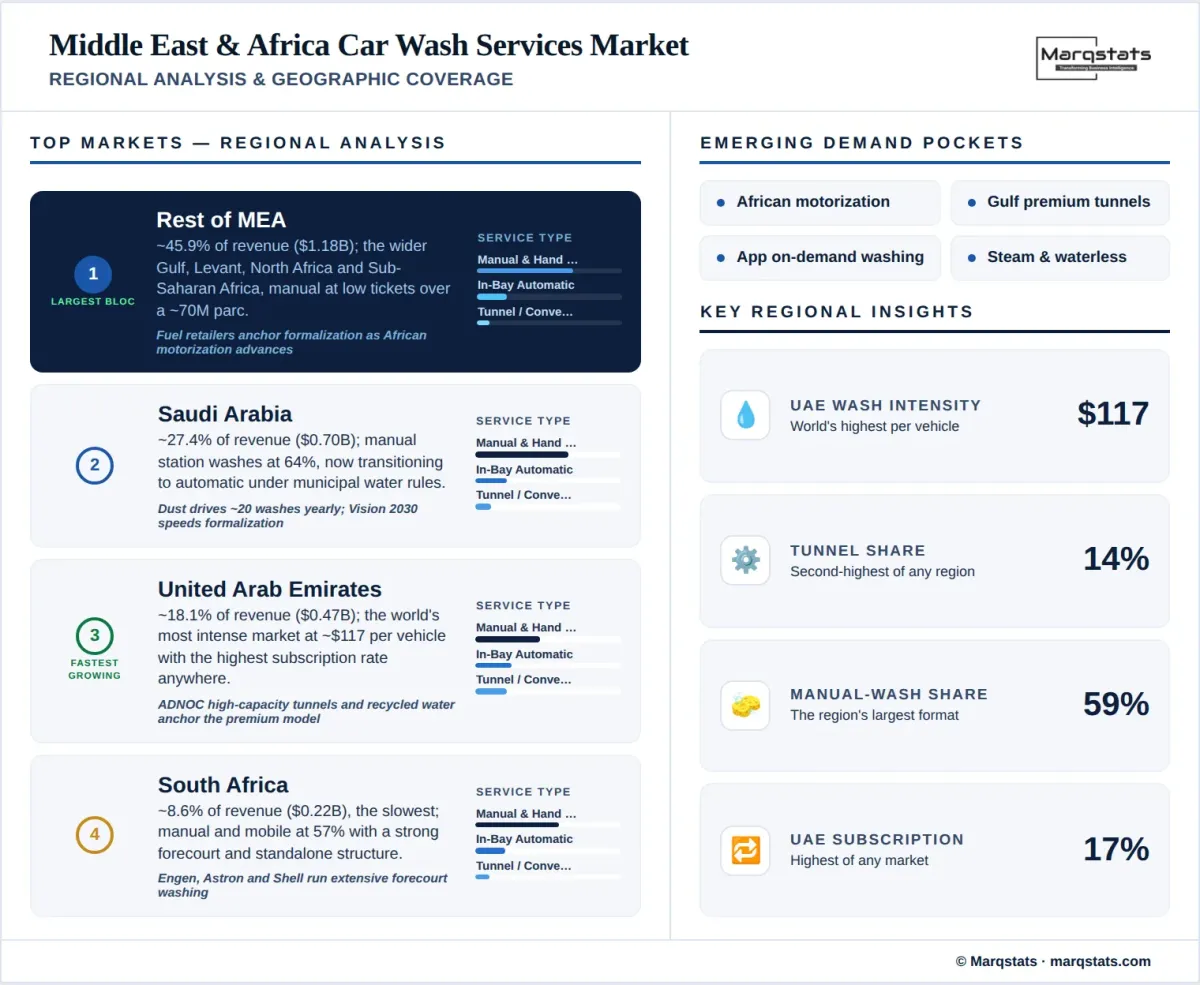
Middle East Africa Car Wash Services Market Regional Analysis Geographic Coverage Infographic
Competitive Landscape

How Competition Is Evolving

The Middle East & Africa car wash services market is fragmented and diverse, with competitive structures differing sharply between the organized Gulf markets and the largely informal wider region. Fuel retailers dominate organized supply: ADNOC Distribution operates the United Arab Emirates' largest wash network with high-capacity tunnels and recycled-water systems, ENOC and Emarat add forecourt washing, and in Saudi Arabia Petromin Express, SASCO, and Aldrees anchor the market. In South Africa, Engen, Astron Energy, Sasol, and Shell operate extensive forecourt networks.

App-based and specialist operators form a distinct tier. CAFU and other mobile services in the United Arab Emirates, Careem's Ezhalha platform across the Gulf, and steam and waterless specialists compete on convenience and water efficiency. Across the wider region, TotalEnergies, Vivo Energy, and Ola Energy operate forecourt washing at fuel stations spanning North and Sub-Saharan Africa, while independent and informal operators serve the bulk of demand outside the Gulf.

Competition turns on water efficiency, automation, subscription reach, and forecourt convenience. Gulf water regulation and premium positioning separate advanced, water-efficient operators from traditional rivals, subscription plans build recurring revenue from very high frequency, and fuel retailers compete on network scale and fuel-linked loyalty. Equipment suppliers WashTec, Karcher, and Istobal, together with water-recycling providers, underpin the automated tiers. Formalization is expected to advance fastest in the Gulf through regulation and investment, while the wider region formalizes gradually with rising motorization through 2030.
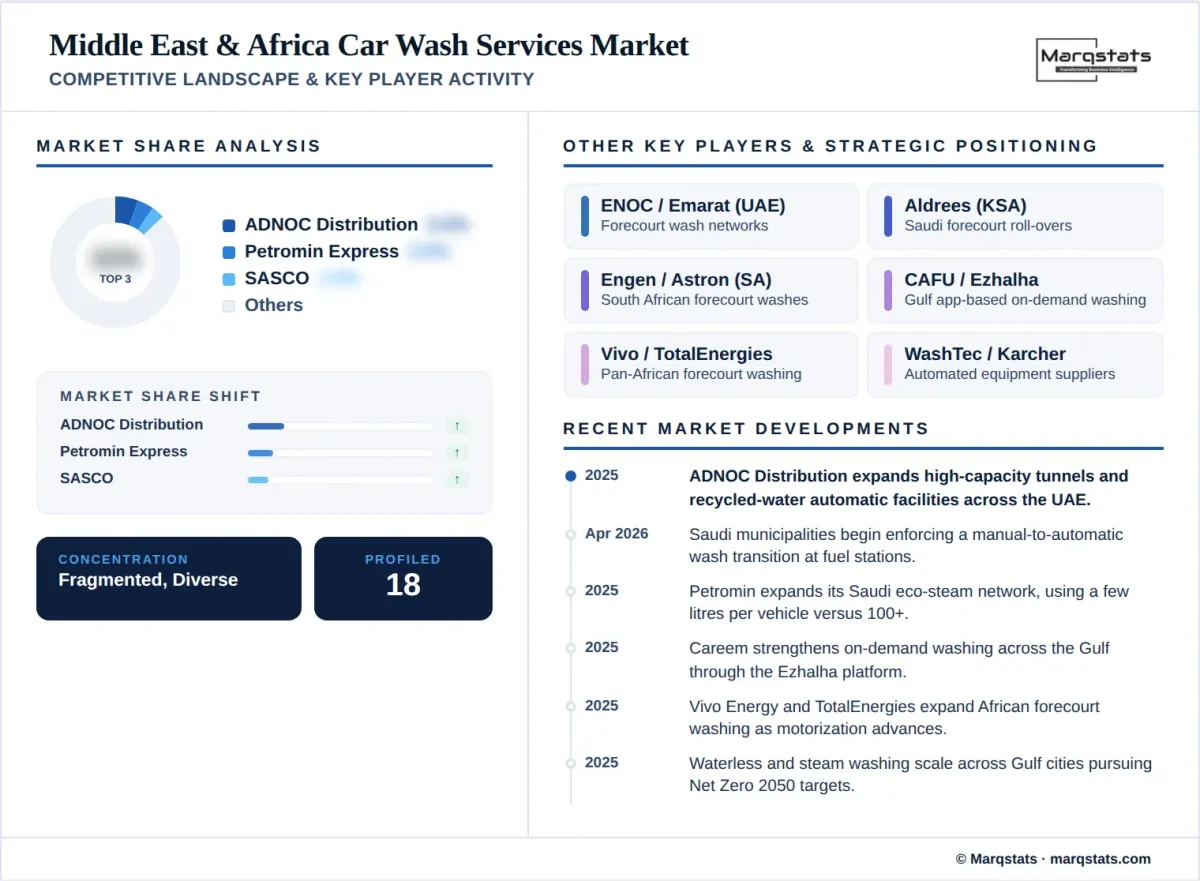
Middle East Africa Car Wash Services Market Competitive Landscape Key Player Activity Infographic
Major Players

Companies Covered

The report profiles 18++ companies with full strategy and financials analysis, including:

ADNOC Distribution PJSC
Emirates National Oil Company (ENOC)
Emarat (Emirates General Petroleum Corporation)
CAFU
Petromin Corporation (Petromin Express Car Wash)
Saudi Automotive Services Company (SASCO)
Aldrees Petroleum & Transport Services Co.
Ezhalha (Careem)
Engen Petroleum Ltd.
Astron Energy (Pty) Ltd.
Sasol Limited
Shell Downstream / Vivo Energy
TotalEnergies Marketing (Middle East & Africa)
Ola Energy (OiLibya)
Alfred Karcher (Middle East & Africa)
WashTec AG
Istobal (MEA operations)
Clean Cloud (Waterless)
Note: Full company profiles include revenue analysis, product portfolio, SWOT, and recent strategic developments.
Latest Developments

Recent Market Activity

2025
ADNOC Distribution expanded high-capacity tunnel washes and recycled-water automatic facilities across its United Arab Emirates network.
Apr 2026
Saudi municipalities began enforcing a transition from manual to automatic car washing at fuel stations, citing water scarcity.
2025
Petromin expanded its eco-steam car wash network in Saudi Arabia, using a few litres per vehicle versus over 100 for traditional washing.
2025
Careem strengthened on-demand car wash across the Gulf through the Ezhalha platform, expanding app-based subscription washing.
2025
Fuel retailers across Africa, including Vivo Energy and TotalEnergies networks, expanded forecourt washing as motorization advanced.
2025
Waterless and steam washing scaled across Gulf cities pursuing Vision 2030 and Net Zero 2050 sustainability targets.
Report Structure

Table of Contents

1. Introduction
1.1 Study Assumptions & Market Definition
1.1.1 Scope — Professional & Informal Car Wash Services (UAE, KSA, South Africa, Rest of MEA)
1.1.2 Formats Covered — Manual, In-Bay Automatic, Tunnel, Self-Service
1.1.3 Inclusions — Four-Wheel Cleaning, Interior, Tickets, Subscriptions
1.1.4 Exclusions — Full Detailing & Equipment/Chemical Sales
1.1.5 Market Metric — Annual Service Revenue (USD)
1.2 Scope of the Study
1.3 Currency, FX Treatment & Base Year (2025)
1.4 Key Definitions & Regional Terminology
1.4.1 Premium Mall & Hand Wash (UAE)
1.4.2 Manual Station Wash (Saudi Arabia)
1.4.3 Informal & Forecourt Washing (South Africa)
1.4.4 Steam, Waterless & Water-Recycling Systems
2. Research Methodology
2.1 Analysis Framework & Regional Aggregation
2.2 UAE Model — Ministry of Interior Parc & ADNOC Disclosures
2.3 Saudi Arabia Model — GASTAT & Traffic-Authority Parc
2.4 South Africa Model — eNaTIS Registration
2.5 Rest of Middle East & Africa — Aggregate Parc (~70M)
2.6 Country-to-Region Summation & Cross-Checks
2.6.1 Wash-Intensity Range (USD 15–117 per Vehicle vs. US ~66)
2.7 FX Treatment — Gulf Pegs, ZAR Effects, Constant-FX Forecast
2.8 Primary Research — 40+ Interviews Across the Region
2.9 Assumptions & Limitations
3. Executive Summary
3.1 MEA Market Size & Forecast Snapshot 2021–2030
3.2 Country Shares — Rest of MEA 45.9%, KSA 27.4%, UAE 18.1%, South Africa 8.6%
3.3 No Single-Country Dominance — Gulf-Led Direction
3.4 World's Highest Wash Intensity & Subscription (UAE)
3.5 Water Scarcity, Automation & Premiumization
4. Market Overview & Definitions
4.1 Regional Structure & Country Contributions
4.1.1 United Arab Emirates — Premium, Tunnel & Highest-Intensity
4.1.2 Saudi Arabia — Dust-Driven, Automation-Mandated
4.1.3 South Africa — Informal & Forecourt-Structured
4.1.4 Rest of Middle East & Africa — Large, Manual, Low-Ticket
4.2 Value Chain & Ecosystem
4.2.1 Fuel Retailers & Forecourt Washing (ADNOC, ENOC, SASCO, Engen)
4.2.2 App-Based On-Demand & Specialist Operators
4.2.3 Equipment & Water-Recycling System Providers
4.3 Combined Vehicle Parc & Wash Behavior
4.4 Wash-Intensity Range & Premium/Emerging Divergence
5. Market Dynamics
5.1 Key Drivers
5.1.1 Dust-Driven Wash Frequency (Highest in the World)
5.1.2 Vehicle-Parc Expansion Across the Region
5.1.3 Vision 2030 & National-Program Formalization
5.1.4 Premiumization & Subscription (UAE-Led)
5.1.5 Water-Efficiency Requirements Favouring Steam & Recycling
5.1.6 Fuel-Retailer Automated-Forecourt Investment
5.2 Key Restraints
5.2.1 Low Tickets in Rest of MEA & South Africa
5.2.2 Currency Depreciation in Non-Pegged Markets
5.2.3 Large Informal Base Across Africa
5.2.4 Water & Energy Costs for Water-Intensive Formats
5.3 Key Trends
5.3.1 High-Capacity Tunnels & Recycled-Water Washes (ADNOC)
5.3.2 Fuel-Station Manual-to-Automatic Mandate (Saudi Arabia)
5.3.3 Subscription & App-Membership Spread from the Gulf
5.3.4 Steam & Waterless Washing Across Gulf Cities
5.4 Porter's Five Forces Analysis
5.5 Regional Value Chain Analysis
6. Regulatory & Environmental Framework
6.1 Saudi Fuel-Station Manual-to-Automatic Wash Mandate
6.2 Gulf Water-Recycling & National Water Strategies
6.3 UAE Net Zero 2050 & Recycled-Water Washing
6.4 Water Scarcity & Conservation Across the Region
6.5 Wastewater, Effluent & Chemical Compliance
7. Technology & Format Innovation
7.1 High-Capacity Tunnel & Touchless Systems
7.2 Steam & Eco-Steam Washing
7.3 Waterless & Water-Recycling Technology
7.4 App-Based On-Demand & Subscription Platforms
7.5 Automated Roll-Over & Forecourt Systems
8. Premiumization & Subscription Economics
8.1 Subscription Model & Recurring Revenue (UAE-Led)
8.2 Subscription Penetration — Highest of Any Market (UAE ~17–24%)
8.3 Fuel-Retailer Membership & Loyalty Programs
8.4 High-Frequency Economics & Premium Positioning
9. Middle East & Africa Car Wash Services Market Sizing & Forecast
9.1 Regional Market Size & Forecast 2021–2030
9.1.1 Historical Revenue 2021–2025 (incl. FX Effect)
9.1.2 Forecast Revenue 2026–2030 (Constant FX)
9.1.3 CAGR & Absolute Growth
9.2 Country-Level Sizing & Share Trend
9.2.1 United Arab Emirates 2021–2030
9.2.2 Saudi Arabia 2021–2030
9.2.3 South Africa 2021–2030
9.2.4 Rest of Middle East & Africa 2021–2030
10. Market Segmentation — By Service Type
10.1 Manual / Hand Wash
10.1.1 Revenue & Share 2021–2030 (~59% of Modeled Revenue)
10.1.2 Premium Mall, Station & Informal Washing
10.2 In-Bay Automatic (Roll-over)
10.2.1 Revenue & Share 2021–2030 (~22%)
10.2.2 Fuel-Forecourt Machines Across the Region
10.3 Tunnel / Conveyor
10.3.1 Revenue & Share 2021–2030 (~14%, Second-Highest of Any Region)
10.3.2 UAE High-Capacity Tunnel Rollout (ADNOC)
10.4 Self-Service
10.4.1 Revenue & Share 2021–2030 (~5%)
11. Market Segmentation — By Site Format
11.1 Fuel-Station Forecourt
11.1.1 Revenue & Share 2021–2030 (~39%, Highest of Any Region)
11.1.2 ADNOC, ENOC, SASCO, Aldrees & Engen Networks
11.2 Standalone Dedicated Sites
11.2.1 Revenue & Share 2021–2030 (~38%)
11.3 Others (Mall Parking, Mobile)
11.3.1 Revenue & Share 2021–2030 (~23%)
12. Market Segmentation — By Payment Model
12.1 Pay-per-Wash
12.1.1 Revenue & Share 2021–2030 (~88%)
12.2 Subscription / Membership
12.2.1 Revenue & Share 2021–2030 (~12%, UAE-Led)
12.2.2 Highest Subscription Penetration of Any Market
13. Market Segmentation — By Vehicle Type
13.1 Passenger Cars
13.1.1 Revenue & Share 2021–2030 (~87%)
13.2 Commercial Vehicles (incl. Fleet)
13.2.1 Revenue & Share 2021–2030 (~13%)
13.2.2 Logistics, Delivery & Ride-Hailing Demand
14. Regional Analysis — By Country
14.1 United Arab Emirates — Fastest & Most Intense — 18.1%, 5.90% CAGR
14.1.1 Market Size & Forecast 2021–2030
14.1.2 World's Highest Intensity (~USD 117/Vehicle) & Subscription (~17%)
14.1.3 ADNOC Tunnel Rollout, Mall-Parking & Mobile
14.2 Saudi Arabia — Largest Single Market — 27.4%, 5.48% CAGR
14.2.1 Market Size & Forecast 2021–2030
14.2.2 Manual Station Base & Fuel-Station Automation Mandate
14.2.3 Vision 2030 Formalization & Eco-Steam (Petromin)
14.3 South Africa — Slowest — 8.6%, 4.00% CAGR
14.3.1 Market Size & Forecast 2021–2030
14.3.2 Informal & Forecourt Washing (Engen, Astron)
14.3.3 Currency Effects & Resilient Demand
14.4 Rest of Middle East & Africa — Largest Bloc — 45.9%, 4.72% CAGR
14.4.1 Market Size & Forecast 2021–2030
14.4.2 Wider Gulf, Levant, North & Sub-Saharan Africa
14.4.3 Low-Ticket Manual Base & Rising Motorization
15. Competitive Landscape
15.1 Regional Structure & Gulf/Wider-Region Divide
15.2 Gulf Fuel Retailers (ADNOC, ENOC, Emarat, SASCO, Aldrees)
15.3 African Fuel Retailers (Engen, Astron, Sasol, Vivo, TotalEnergies)
15.4 App-Based & Specialist Operators (CAFU, Ezhalha, Steam/Waterless)
15.5 Competitive Variables — Water Efficiency, Automation, Subscription, Forecourt
16. Company Profiles
16.1 ADNOC Distribution PJSC
16.1.1 Company Overview
16.1.2 Format & Service / Network Portfolio
16.1.3 Country Footprint & Regional Presence
16.1.4 Water-Efficiency / Subscription / Automation Approach
16.1.5 Recent Strategic Developments
16.2 Emirates National Oil Company (ENOC)
16.2.1 Company Overview
16.2.2 Format & Service / Network Portfolio
16.2.3 Country Footprint & Regional Presence
16.2.4 Water-Efficiency / Subscription / Automation Approach
16.2.5 Recent Strategic Developments
16.3 Emarat (Emirates General Petroleum Corporation)
16.3.1 Company Overview
16.3.2 Format & Service / Network Portfolio
16.3.3 Country Footprint & Regional Presence
16.3.4 Water-Efficiency / Subscription / Automation Approach
16.3.5 Recent Strategic Developments
16.4 CAFU
16.4.1 Company Overview
16.4.2 Format & Service / Network Portfolio
16.4.3 Country Footprint & Regional Presence
16.4.4 Water-Efficiency / Subscription / Automation Approach
16.4.5 Recent Strategic Developments
16.5 Petromin Corporation (Petromin Express Car Wash)
16.5.1 Company Overview
16.5.2 Format & Service / Network Portfolio
16.5.3 Country Footprint & Regional Presence
16.5.4 Water-Efficiency / Subscription / Automation Approach
16.5.5 Recent Strategic Developments
16.6 Saudi Automotive Services Company (SASCO)
16.6.1 Company Overview
16.6.2 Format & Service / Network Portfolio
16.6.3 Country Footprint & Regional Presence
16.6.4 Water-Efficiency / Subscription / Automation Approach
16.6.5 Recent Strategic Developments
16.7 Aldrees Petroleum & Transport Services Co.
16.7.1 Company Overview
16.7.2 Format & Service / Network Portfolio
16.7.3 Country Footprint & Regional Presence
16.7.4 Water-Efficiency / Subscription / Automation Approach
16.7.5 Recent Strategic Developments
16.8 Ezhalha (Careem)
16.8.1 Company Overview
16.8.2 Format & Service / Network Portfolio
16.8.3 Country Footprint & Regional Presence
16.8.4 Water-Efficiency / Subscription / Automation Approach
16.8.5 Recent Strategic Developments
16.9 Engen Petroleum Ltd.
16.9.1 Company Overview
16.9.2 Format & Service / Network Portfolio
16.9.3 Country Footprint & Regional Presence
16.9.4 Water-Efficiency / Subscription / Automation Approach
16.9.5 Recent Strategic Developments
16.10 Astron Energy (Pty) Ltd.
16.10.1 Company Overview
16.10.2 Format & Service / Network Portfolio
16.10.3 Country Footprint & Regional Presence
16.10.4 Water-Efficiency / Subscription / Automation Approach
16.10.5 Recent Strategic Developments
16.11 Sasol Limited
16.11.1 Company Overview
16.11.2 Format & Service / Network Portfolio
16.11.3 Country Footprint & Regional Presence
16.11.4 Water-Efficiency / Subscription / Automation Approach
16.11.5 Recent Strategic Developments
16.12 Shell Downstream / Vivo Energy
16.12.1 Company Overview
16.12.2 Format & Service / Network Portfolio
16.12.3 Country Footprint & Regional Presence
16.12.4 Water-Efficiency / Subscription / Automation Approach
16.12.5 Recent Strategic Developments
16.13 TotalEnergies Marketing (Middle East & Africa)
16.13.1 Company Overview
16.13.2 Format & Service / Network Portfolio
16.13.3 Country Footprint & Regional Presence
16.13.4 Water-Efficiency / Subscription / Automation Approach
16.13.5 Recent Strategic Developments
16.14 Ola Energy (OiLibya)
16.14.1 Company Overview
16.14.2 Format & Service / Network Portfolio
16.14.3 Country Footprint & Regional Presence
16.14.4 Water-Efficiency / Subscription / Automation Approach
16.14.5 Recent Strategic Developments
16.15 Alfred Kärcher (Middle East & Africa)
16.15.1 Company Overview
16.15.2 Format & Service / Network Portfolio
16.15.3 Country Footprint & Regional Presence
16.15.4 Water-Efficiency / Subscription / Automation Approach
16.15.5 Recent Strategic Developments
16.16 WashTec AG
16.16.1 Company Overview
16.16.2 Format & Service / Network Portfolio
16.16.3 Country Footprint & Regional Presence
16.16.4 Water-Efficiency / Subscription / Automation Approach
16.16.5 Recent Strategic Developments
16.17 Istobal (MEA operations)
16.17.1 Company Overview
16.17.2 Format & Service / Network Portfolio
16.17.3 Country Footprint & Regional Presence
16.17.4 Water-Efficiency / Subscription / Automation Approach
16.17.5 Recent Strategic Developments
16.18 Clean Cloud (Waterless)
16.18.1 Company Overview
16.18.2 Format & Service / Network Portfolio
16.18.3 Country Footprint & Regional Presence
16.18.4 Water-Efficiency / Subscription / Automation Approach
16.18.5 Recent Strategic Developments
17. Investment, Formalization & Automation Analysis
17.1 Gulf Automated-Forecourt & Tunnel Investment
17.2 Water-Recycling, Steam & Waterless Capex
17.3 Subscription & App-Platform Investment
17.4 African Fuel-Retail Expansion & Consolidation
18. Opportunities, Risks & Strategic Recommendations
18.1 Growth Opportunities by Country & Format
18.2 Ticket, Currency, Water & Regulation Risk Assessment
18.3 Premiumization, Subscription & Water-Efficiency Strategy
18.4 Strategic Recommendations for Operators & Investors
19. Appendix
19.1 Research Methodology Detail
19.2 Country Model Aggregation & Confidence Flags
19.3 Abbreviations & Glossary
19.4 List of Tables
19.5 List of Figures
19.6 Disclaimer & Legal Notice
Study Scope & Focus

Coverage & Segmentation

This report provides a comprehensive analysis of the Middle East & Africa car wash services market covering the historical period 2021 to 2025 and the forecast period 2026 to 2030, with 2025 as the base year. The study aggregates the United Arab Emirates, Saudi Arabia, South Africa, and the Rest of Middle East & Africa, defining the market as annual revenue earned by professional and informal operators cleaning four-wheel vehicles through manual, in-bay automatic, tunnel/conveyor, and self-service formats, inclusive of basic interior cleaning; full detailing and equipment or chemical sales are excluded. Market size is presented in value terms (USD), with Gulf currencies pegged to the dollar and South African rand and other currency effects embedded in historical figures; forecasts assume constant exchange rates.

The study segments the market by service type, site format, payment model, and vehicle type, with segment aggregates computed across the three modeled major markets, and examines country demand, water policy, formalization, and premiumization across all four components. Market sizing aggregates bottom-up country models anchored to Ministry of Interior, GASTAT, and eNaTIS vehicle data, cross-checked against wash intensity per vehicle. The competitive section profiles 18 fuel retailers, specialist operators, and equipment makers spanning the region.

Frequently Asked Questions

FAQs About the Middle East & Africa Car Wash Services Market

The Middle East & Africa car wash services market is valued at approximately USD 2.56 billion in 2025 and is projected to reach USD 3.29 billion by 2030, expanding at a 5.09% CAGR. It aggregates the UAE, Saudi Arabia, South Africa, and the Rest of Middle East & Africa.
The market is expected to grow at a 5.09% CAGR between 2025 and 2030, driven by parc expansion, Gulf formalization, and premiumization, with the UAE the fastest-growing major market at a 5.90% CAGR.
No single country dominates. The Rest of Middle East & Africa forms the largest bloc at about 45.9% of 2025 revenue, followed by Saudi Arabia at 27.4%, the UAE at 18.1%, and South Africa at 8.6%; the two Gulf markets together set the region's direction.
The UAE has the highest wash intensity of any market worldwide at about USD 117 per vehicle — roughly 178% of the United States level — because a small parc is washed about 24 times per year at premium tickets, driven by desert dust, and subscription penetration is the highest of any market.
Manual and hand-wash formats form the largest service type at about 59% of modeled-market revenue, with in-bay automatic second at about 22% and tunnels a notable 14% — the second-highest tunnel share of any region, driven by the UAE's premium tunnel rollout.
Major players include Gulf fuel retailers ADNOC Distribution, ENOC, SASCO, and Aldrees; steam specialist Petromin Express; African retailers Engen, Astron, Sasol, Vivo Energy, and TotalEnergies; and app-based operators CAFU and Careem's Ezhalha.
The report is delivered as a PDF report (300+ pages), Excel data tables with market sizing across 2021–2030 by country, segment, and format, and a PowerPoint summary deck, with analyst email support included in every licence tier.