Market Snapshot
The Australia used car market size is estimated at USD 36,415.01 million in 2025 and is projected to reach USD 44,787.01 million by 2030, growing at a CAGR of 4.23% over 2026 – 2030. Transactions rise from 2,316,208 to about 2,440,000 a year, while the average transaction value climbs from about AUD 24,371 to AUD 28,453.
Marqstats defines the market as the value of final retail changes of ownership of used light vehicles in Australia: passenger cars, SUVs, utes, and vans and light buses sold by franchised and independent dealers or between private parties, such as a used Ford Ranger, Toyota RAV4 or Tesla Model 3. Value is the price paid by the buyer, including GST where a dealer charges it and excluding stamp duty and on-road costs. Auction and wholesale movements between businesses, heavy trucks and motorcycles are excluded.
SUVs account for 48.45% of 2025 value and grow fastest among body types, while battery-electric vehicles grow fastest overall at 31.03% a year. Licensed dealers handle 48.60% of transactions but 68.05% of value, and New South Wales is the largest state with 28.99% of value.
Key Takeaways
Market Overview & Analysis
Report Summary
Marqstats sizes the Australia used car market as the value of final retail changes of ownership of used light vehicles in a calendar year. It counts every used passenger car, SUV, ute, van and light bus bought by a household, sole trader or business from a licensed dealer or a private seller. Auction sales, dealer-to-dealer trades and fleet transfers between businesses are intermediate movements and are left out so that a vehicle is counted once, when it reaches its next user. Heavy trucks above 4.5 tonnes, motorcycles and caravans are excluded.
The volume base is the transaction series that the Australian Automotive Dealer Association (AADA) publishes with AutoGrab. Their 2025 annual Automotive Insights Report, released on 28 January 2026, counted 2,316,208 used vehicle sales, 0.37% fewer than in 2024. The count treats a vehicle delisted from the main online marketplaces as sold, so it captures dealer and private sales that are advertised online. It splits the year into 996,614 SUVs, 840,490 passenger cars, 409,937 utes and 69,167 vans and buses, and into 1,422,518 petrol, 725,203 diesel, 128,914 hybrid, 33,610 battery-electric, 2,950 plug-in hybrid and 3,013 LPG vehicles.
Used vehicles are the main way Australians buy cars. New vehicle sales were a record 1,241,037 in 2025 under the Federal Chamber of Automotive Industries (FCAI) VFACTS series, up only 0.3%, so the used market turns over 1.87 vehicles for every new one. The fleet is ageing: AADA put the average passenger vehicle at 11.3 years and the average light commercial vehicle at 11.6 years in March 2026, up from 11.2 and 11.4, as 65% of surveyed owners said they expect to keep their cars longer because of living costs.
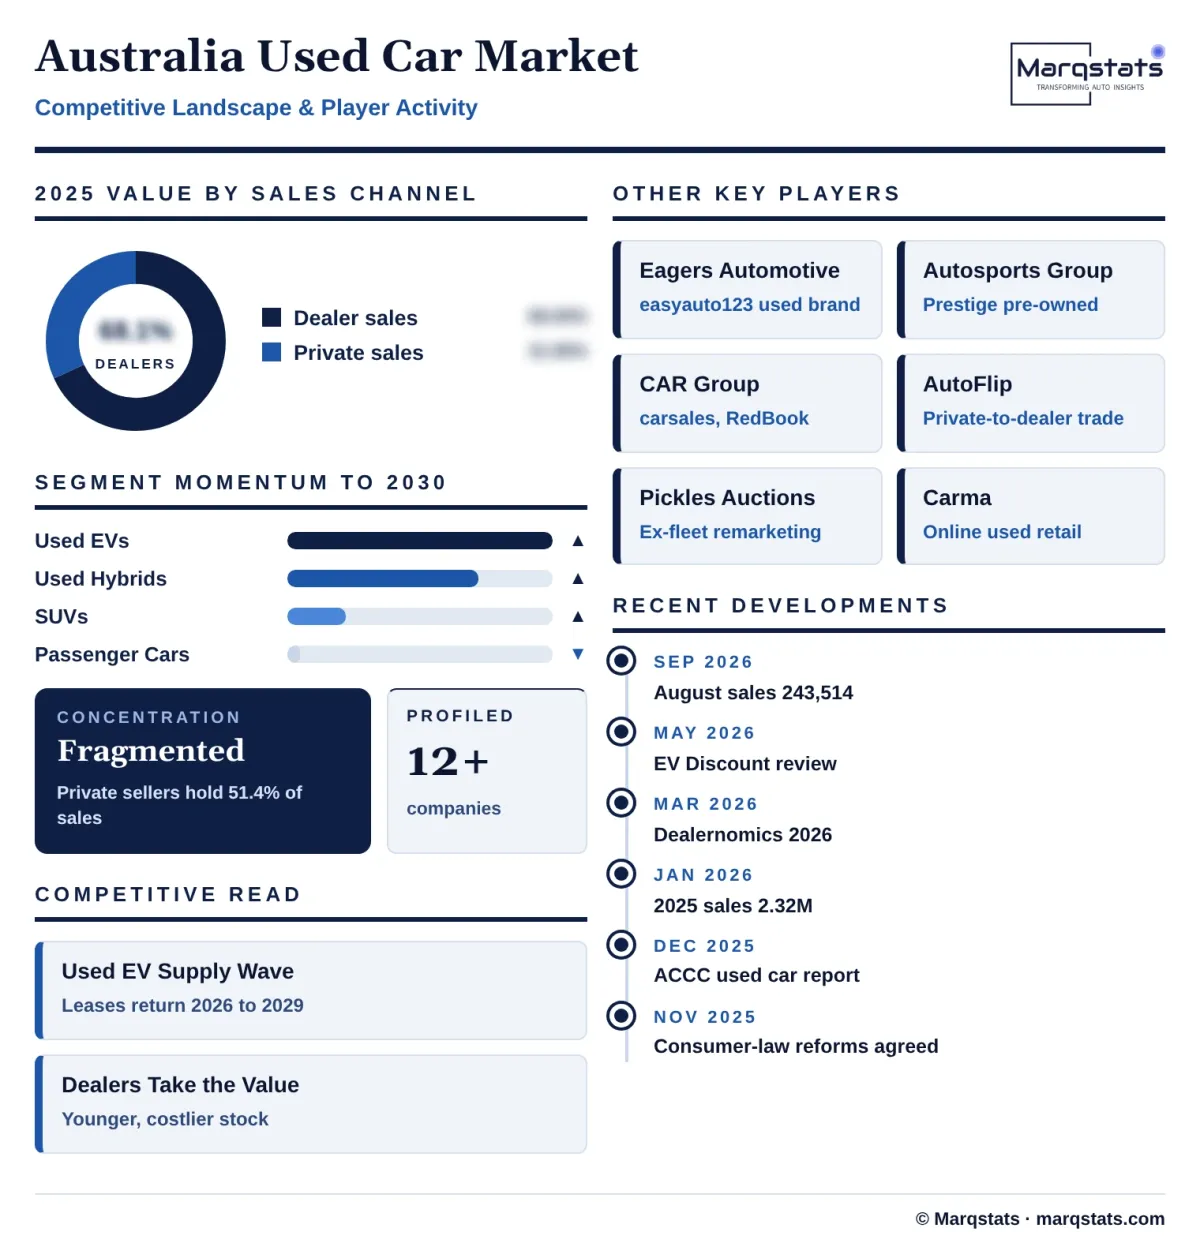
The channel changed more in 2025 than in any recent year. AADA reported the dealer share of transactions at 48.6%, up from 39.1% in 2024, and private sales fell to 51.4%. Buyers moved toward dealers for financing, trade-ins, statutory warranties and protection under the Australian Consumer Law, while the Australian Competition and Consumer Commission (ACCC) recorded more than 14,000 consumer reports about second-hand cars across national and state agencies in 2024 – 25.
Marqstats values the 2025 market at AUD 56.45 billion, equal to USD 36,415.01 million at the 2025 average rate of AUD 1 = USD 0.6451. The research pack figure of AUD 79.21 billion applied an average of AUD 34,200 to every transfer, a price that fits late-model dealer stock but not the private market, where the typical car offered to dealers through AutoFlip in 2026 was a 2015 or 2016 model with about 140,000 to 150,000 kilometres. Marqstats instead prices dealer and private sales separately by body type.
Australia Used Car Market Size and Forecast
The Australia used car market grows from USD 36,415.01 million in 2025 to USD 44,787.01 million in 2030, a CAGR of 4.23%. Transactions add 1.05% a year, from 2,316,208 to 2,440,000, and the average transaction value adds 3.15% a year, from about AUD 24,371 to AUD 28,453, so price and mix explain about three quarters of the growth.
The 2025 value is built from units and prices by channel and body type. Marqstats estimates dealer sales of 1,125,677 vehicles at an average of about AUD 34,126, with SUVs at about AUD 37,000, passenger cars at AUD 24,000, utes at AUD 45,000 and vans at AUD 38,000, and private sales of 1,190,531 vehicles at about AUD 15,148, with SUVs at AUD 16,500, passenger cars at AUD 10,500, utes at AUD 22,000 and vans at AUD 17,000. Dealer value of AUD 38.41 billion compares with AUD 10.96 billion of used retail turnover at franchised new-car dealers implied by AADA Dealernomics 2026 (12% of AUD 91.3 billion), which leaves the rest to independent yards and online retailers.
Price checks support the base. Pickles Auctions reported an average selling price of AUD 36,000 for used electric vehicles of about 2.5 years in 2025, against the Marqstats battery-electric average of about AUD 35,307, and its used car price index stood at 126 in the fourth quarter of 2025, 1% above a year earlier. A carsales consumer survey in January 2026 found almost 60% of buyers planned to spend less than AUD 30,000 on their next car, which matches an all-market average near AUD 24,371.
2026 is a pause year. AADA data cited by AutoFlip showed first-half 2026 used sales down 6.6% year on year, followed by a recovery to 240,311 sales in July and 243,514 in August. Marqstats puts 2026 at about 2,270,000 transactions and USD 36,826.07 million, with value still up 1.13% because hybrids, electric vehicles and dealer sales carry higher prices. From 2027 the record new-car years of 2023 to 2025 feed more three- to five-year-old vehicles into the market and transactions grow at just over 1% a year.
Marqstats tracks four indicators to monitor the forecast: the monthly AADA and AutoGrab sales, listings and days-to-sell series, the dealer share of transactions, the retained value of two- to four-year-old battery-electric vehicles, and the Government response to the Treasury review of the Electric Car Discount, which decides how fast novated-lease electric vehicles keep entering the fleet.
Market Dynamics
Key Drivers
Five forces keep used-car demand and value rising in Australia even as transaction counts flatten.
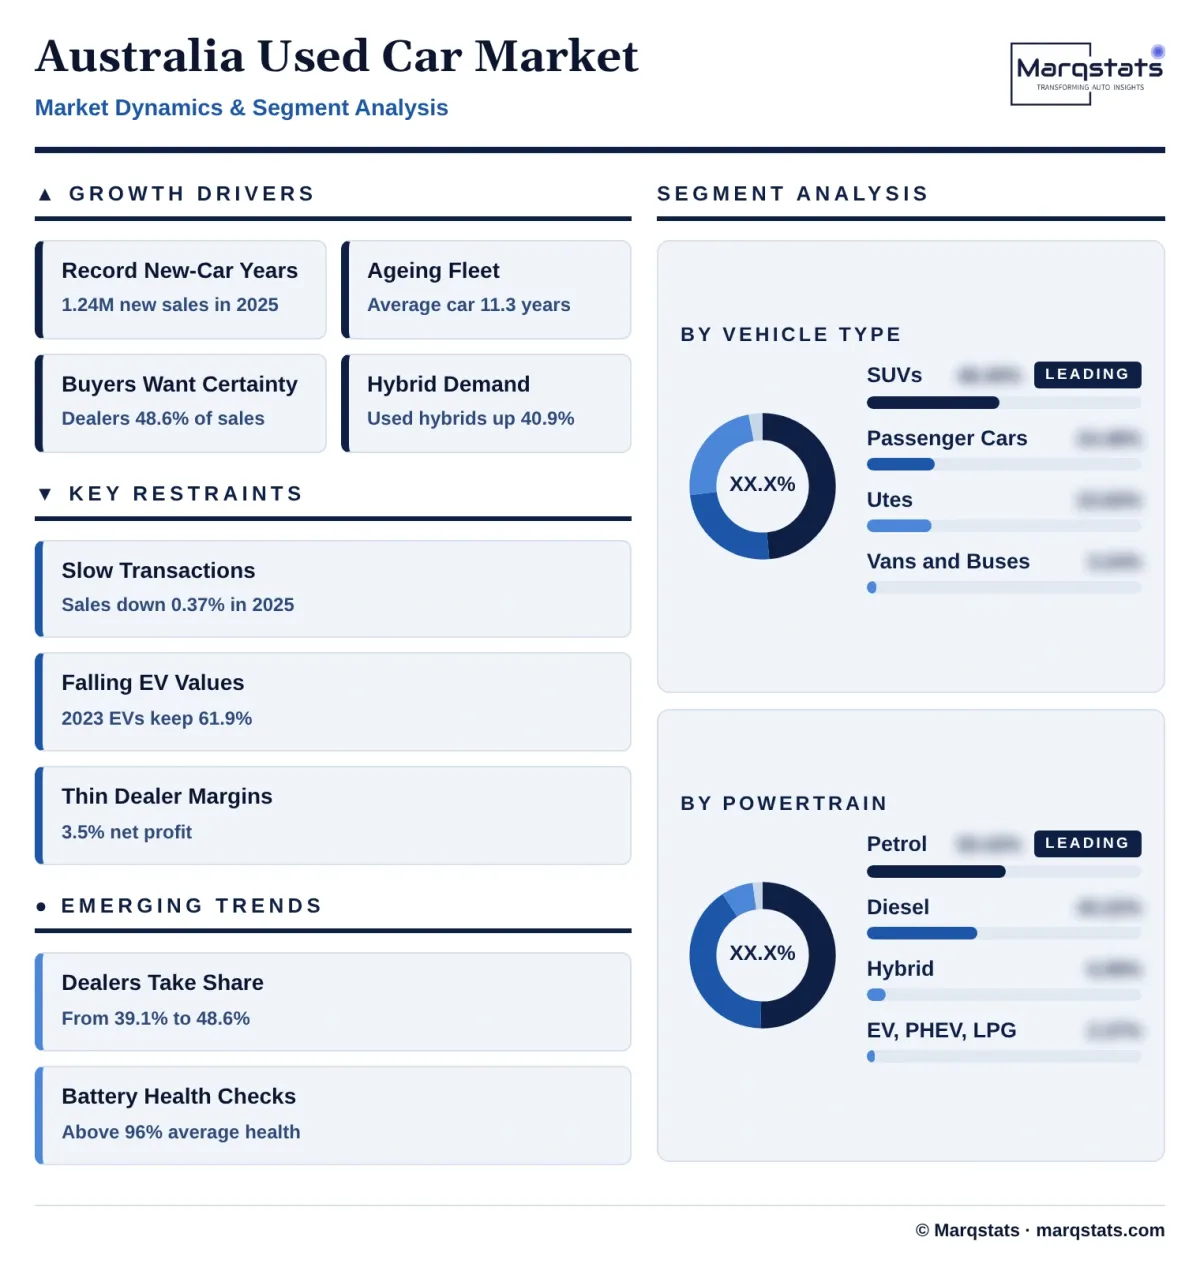
- Record new-car years refill the used pool. New vehicle sales exceeded 1.2 million in each year from 2023 to 2025 and reached a record 1,241,037 in 2025, so three- to five-year-old trade-ins and ex-lease vehicles arrive in larger numbers from 2026 to 2030. That supply lifts dealer stock and keeps prices of late-model used cars close to their new-car cost.
- A larger, older fleet needs replacing. Registered vehicles rose from 20.4 million in 2024 to 20.9 million in 2025, or 764 per 1,000 people, and the average passenger vehicle is 11.3 years old. Every year more of that fleet reaches the age at which owners sell or scrap, which keeps used transactions above two million a year even when new sales stall.
- Buyers pay for certainty. Licensed dealers must meet Australian Consumer Law guarantees, and state statutory warranties typically cover cars under 10 years old and under 160,000 kilometres for 3 months or 5,000 kilometres. The dealer share rose from 39.1% to 48.6% in one year, and dealers sold 75% of used electric vehicles in December 2025, because buyers of newer and costlier cars want finance, trade-ins and recourse.
- Fuel costs push buyers to hybrids. The oil shock linked to the Strait of Hormuz in March 2026 put fuel costs back at the top of buyer concerns, and used hybrid sales had already grown 40.9% in 2025. A two- to four-year-old Toyota Corolla, Camry or RAV4 hybrid sells in under 40 days in Victoria, and hybrid supply grows with the 199,133 new hybrids sold in 2025.
- Tax settings lift used electric demand. The Electric Car Discount exempts eligible battery-electric cars from Fringe Benefits Tax under novated leases, and a used electric car qualifies if it was first used on or after 1 July 2022. The Treasury review found used electric vehicles rose from 0.7% of the used market in 2023 to 1.5% in 2025, and that the exemption widens access to middle-income buyers.
Key Restraints
Four constraints hold transaction growth near one percent a year and put pressure on dealer margins.
- Transaction growth is slow. The 2025 count fell 0.37% and first-half 2026 sales fell 6.6% year on year, while average days to sell rose from 42.4 days in October 2025 to 49.4 in January 2026. More cars are listed than buyers absorb, so dealers discount: by June 2026 more than half of one- to five-year-old vehicles sold had been reduced from their asking price.
- Electric vehicle values fall fast. Victorian dealer data for December 2025 showed 2023 model electric cars retaining 61.9% of their new price and 2022 models 55.7%, against 80.5% to 83.8% for 2023 SUVs and passenger cars, and electric vehicles took 61.1 days to sell in January 2026. Price cuts on new BYD, MG and Tesla models pass straight into used values.
- Dealer margins are thin. The AADA benchmark dealership of AUD 100 million turnover earned a net profit of 3.5%, with floorplan interest at 8.0% of gross profit, and used vehicles produce only 10% of dealer gross profit. Slower stock turns cut into that margin, which limits how much used stock dealers can carry.
- Consumer-law reform raises compliance costs. Consumer ministers agreed on 23 November 2025 to prohibit unfair trading practices and introduce penalties for failing to provide consumer guarantee remedies, with draft law expected in 2026, while New South Wales has required licence numbers in online dealer advertisements since 1 September 2025. Smaller yards bear these costs on fewer sales. The New Vehicle Efficiency Standard, with emissions credits and penalties for importers from 1 July 2025, also pushes up list prices of high-emission new utes, which holds used diesel ute values up but makes trade-in valuations harder to set.
Key Trends
Four shifts are changing where Australians buy used vehicles, what they buy and what it is worth.
- Dealers win share from private sellers. The dealer share moved from 39.1% to 48.6% in 2025 and was 50.5% of December 2025 sales, and digital trade-in platforms such as AutoFlip, with more than 1,250 licensed wholesale buyers, let dealers buy private cars directly before they are listed.
- The used fleet electrifies from the top. Hybrid, battery-electric and plug-in hybrid vehicles were 7.14% of 2025 transactions, and the cars sold to dealers through AutoFlip in 2026 averaged a 2022 model year for electric vehicles against 2015 for petrol cars, so electrified supply is concentrated in late-model, dealer-sold stock.
- Battery health becomes a sales tool. Pickles Auctions tested more than 1,500 used electric vehicles in 2025 and found average battery state of health above 96%, and about 90% after 120,000 kilometres, giving dealers evidence to answer buyer worries about battery wear.
- Utes keep their value. The Ford Ranger was the most traded used vehicle in 2025 with 92,197 sales, up 11.8%, and 2023 model utes retained 86.8% of their new price in December 2025, higher than SUVs or passenger cars of the same age.
Strategic Implications
- For dealer groups, the share gain is the opportunity and stock turn is the risk. Dealers added about 216,678 transactions in 2025, but days to sell are rising, so groups that buy direct from private owners and recondition centrally can grow used volume without carrying more floorplan debt.
- For lenders and novated-lease providers, residual values on electric vehicles are the key exposure. With 2022 to 2023 electric models retaining 55.7% to 61.9% of their new price and more than 100,000 novated electric cars due back, lease pricing should assume lower residuals and battery-health reporting at hand-back.
- For online marketplaces and trade-in platforms, the move from private to dealer sales shifts revenue from private listings to dealer advertising, data and instant-offer services; platforms that serve both sides of the trade capture the change.
- For buyers and fleet managers, used hybrids hold value best and used electric vehicles are the cheapest route to low running costs. A buyer who takes a two- to three-year-old battery-electric car under the FBT exemption carries less depreciation risk than the first owner.
- For policy makers, a graduated phase-down of the Electric Car Discount, as the Treasury review recommends, protects used electric values; a sudden end would push more ex-lease electric vehicles onto the market at once and weaken prices.
Market Segmentation
SUVs account for 48.45% of 2025 value, USD 17,644.44 million, and grow fastest among body types at 6.71% a year to USD 24,419.15 million. AADA counted 996,614 used SUV sales in 2025, 43.02% of transactions, and Marqstats expects 1,220,000 by 2030, 50.00%. The Toyota RAV4, Mazda CX-5, Hyundai Tucson and Mitsubishi Outlander lead, and the Toyota LandCruiser, Nissan Patrol and Suzuki Jimny hold close to or above their new price in the used market.
Passenger cars account for 24.48% of 2025 value, USD 8,913.77 million, and are the only body type in decline, falling at 1.29% a year to USD 8,353.58 million. They were 840,490 of 2025 transactions and fall to about 700,000 by 2030 as makers dropped small sedans and hatchbacks from new ranges. Scarcity supports prices: the Toyota Corolla, Hyundai i30 and Mazda3 sell quickly, and a two- to four-year-old Corolla retained 94.0% of its new price in December 2025.
Utes account for 23.83% of 2025 value, USD 8,676.61 million, and grow at 4.04% a year to USD 10,574.56 million. AADA counted 409,937 used ute sales in 2025. The Ford Ranger, Toyota HiLux, Mitsubishi Triton and Isuzu D-Max serve trades, farms, mines and families, and utes carry the highest average dealer price in the analysis, about AUD 45,000.
Vans and light buses account for 3.24% of 2025 value, USD 1,180.19 million, and grow at 4.06% a year to USD 1,439.72 million. The 69,167 sales of 2025 are mainly Toyota HiAce, Hyundai Staria and Volkswagen Transporter vans and Toyota Coaster buses bought by tradespeople, couriers and tour operators.
Petrol vehicles account for 50.42% of 2025 value, USD 18,359.78 million, and decline at 1.36% a year to USD 17,141.49 million. Petrol sales fell 4.0% in 2025 to 1,422,518, 61.41% of transactions, and Marqstats expects about 1,193,800 by 2030 as hybrids replace them in the small-car and mid-size SUV classes.
Diesel vehicles account for 40.22% of 2025 value, USD 14,645.43 million, and grow at 2.89% a year to USD 16,885.91 million. Diesel sales held almost flat at 725,203 in 2025 because utes and large four-wheel-drive wagons such as the Toyota LandCruiser Prado run on diesel, and towing and remote travel keep demand steady.
Hybrids account for 6.99% of 2025 value, USD 2,544.69 million, and grow at 22.32% a year to USD 6,968.22 million and 15.56% of the market. Used hybrid sales rose from 91,516 in 2024 to 128,914 in 2025, and Marqstats expects 330,000 by 2030, led by Toyota RAV4, Camry, Corolla and Corolla Cross hybrids.
Battery-electric vehicles account for 2.10% of 2025 value, USD 765.51 million, and grow fastest at 31.03% a year to USD 2,956.22 million. Sales rose 64.3% from 20,460 to 33,610 in 2025 and reach about 140,000 by 2030, a 33.02% unit CAGR, led by the Tesla Model 3 and Model Y, BYD Atto 3, MG ZS EV, Polestar 2 and Kia EV6. Value grows more slowly than units because retained values fall.
Plug-in hybrid and LPG vehicles account for 0.27% of 2025 value, USD 99.60 million, and grow at 53.00% a year to USD 835.17 million. Plug-in hybrid sales rose 21.0% to 2,950 in 2025, and the 53,484 new plug-in hybrids sold that year, up 130.9%, feed the used market from 2027. LPG cars fall from 3,013 sales as the old Ford Falcon and Holden Commodore taxi and fleet stock retires.
Licensed dealers account for 68.05% of 2025 value, USD 24,781.47 million, and grow at 5.46% a year to USD 32,319.85 million and 72.16% of the market. Dealers sold 1,125,677 vehicles in 2025, 48.6% of transactions, through franchised groups such as Eagers Automotive and Autosports Group, independent yards and online retailers such as Carma and Cars24 Australia. Marqstats expects the dealer share of transactions to reach 53.00% by 2030.
Private sales account for 31.95% of 2025 value, USD 11,633.54 million, and grow at 1.39% a year to USD 12,467.16 million. Private sellers handled 1,190,531 transactions in 2025, 51.4%, mostly older and cheaper vehicles sold through carsales, Facebook Marketplace and Gumtree, at an average of about AUD 15,148. Buyers carry the risk of defects and finance owed, and a Personal Property Securities Register search is their main protection.
By Geography
New South Wales
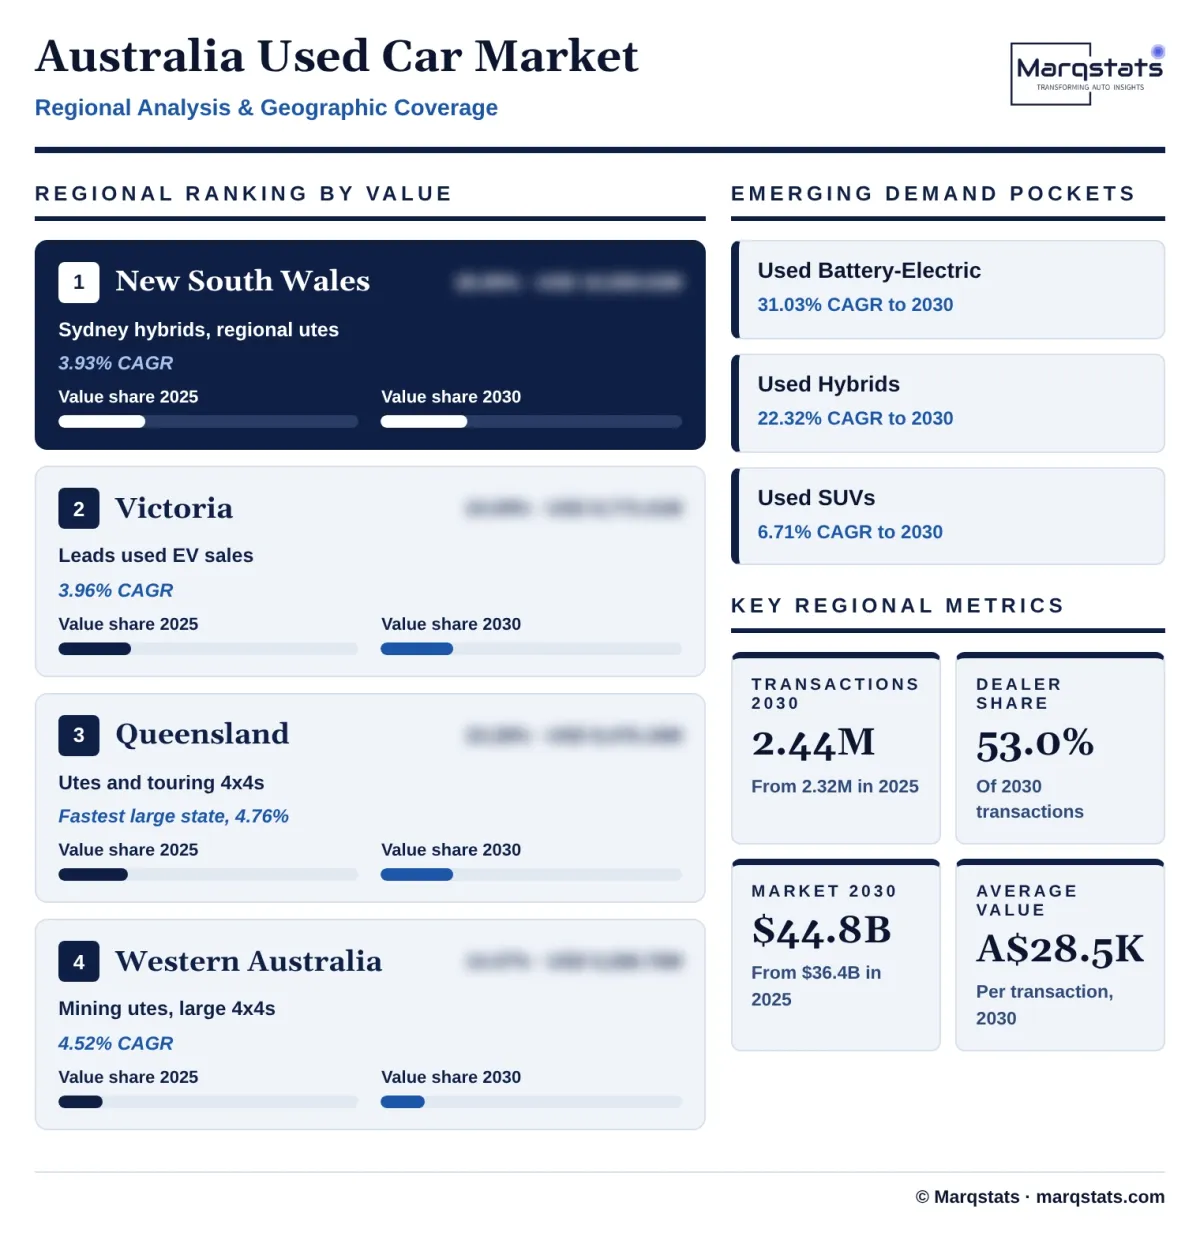
New South Wales accounts for 28.99% of 2025 value, USD 10,559.63 million, from about 675,578 transactions, and grows at 3.93% a year to USD 12,801.89 million by 2030. It is the largest state. Sydney commuters buy late-model hybrids and small SUVs, and regional New South Wales buys utes; New South Wales required dealer licence numbers in online advertisements from 1 September 2025.
Victoria
Victoria accounts for 24.09% of 2025 value, USD 8,773.41 million, from about 572,754 transactions, and grows at 3.96% a year to USD 10,653.43 million by 2030. It is the second-largest market. Melbourne leads used electric vehicle sales, with 794 of 2,405 national used electric sales in December 2025, and Victorian dealer data are the benchmark for retained values.
Queensland
Queensland accounts for 23.28% of 2025 value, USD 8,476.16 million, from about 526,487 transactions, and grows at 4.76% a year to USD 10,693.90 million by 2030. It is the third-largest state and grows fastest among the large states, helped by population growth in south-east Queensland and strong demand for diesel utes and touring four-wheel drives.
Western Australia
Western Australia accounts for 14.47% of 2025 value, USD 5,268.75 million, from about 312,111 transactions, and grows at 4.52% a year to USD 6,572.46 million by 2030. It buys more utes and large four-wheel drives for mining and remote travel, which lifts its average transaction value above the national average, and its population grows faster than the national rate.
South Australia
South Australia accounts for 5.97% of 2025 value, USD 2,172.48 million, from about 151,076 transactions, and grows at 3.89% a year to USD 2,629.47 million by 2030. It has an older fleet and lower average prices, with demand for mid-age family cars and work utes around Adelaide; the state raised penalties for odometer tampering and unlicensed dealing.
Tasmania
Tasmania accounts for 1.82% of 2025 value, USD 661.09 million, from about 48,062 transactions, and grows at 3.71% a year to USD 793.03 million by 2030. It has the oldest vehicles and the lowest average prices among the states, with demand for small cars, hatchbacks and light commercial vehicles.
Australian Capital Territory
Australian Capital Territory accounts for 1.07% of 2025 value, USD 390.27 million, from about 23,555 transactions, and grows at 4.82% a year to USD 493.87 million by 2030. It has the highest share of electric vehicles in its fleet and a higher average price, as Canberra buyers trade late-model passenger cars and electric vehicles.
Northern Territory
Northern Territory accounts for 0.31% of 2025 value, USD 113.22 million, from about 6,585 transactions, and grows at 5.64% a year to USD 148.96 million by 2030. It is the smallest market, dominated by four-wheel drives and diesel utes for remote travel, and has the highest average value per transaction.
How Competition Is Evolving
The market is fragmented. Private sellers handle 51.4% of transactions, and the dealer side is split among about 3,868 franchised new-car dealerships counted by AADA, thousands of independent yards and a few online retailers. No single seller holds a large share of transactions; the listed dealer groups compete on reconditioning scale, finance and trade-in reach rather than on price alone.
Eagers Automotive Limited is the largest listed dealer group and runs easyauto123, a stand-alone used-car brand, beside its franchised dealerships. Autosports Group Limited focuses on prestige brands such as Audi, BMW, Mercedes-Benz and Porsche, where certified pre-owned programmes support margins, and Peter Warren Automotive Holdings Limited operates multi-franchise dealerships in New South Wales and Queensland.
Online platforms set the terms of the market. CAR Group Limited runs carsales.com.au and the RedBook valuation database used by dealers, lenders and insurers, while Facebook Marketplace and Gumtree carry many private listings. AutoGrab supplies the data behind the AADA monthly sales series, and AutoFlip connects private sellers with more than 1,250 licensed buyers.
Remarketing and online retail form a further layer. Pickles Auctions sells ex-fleet, ex-lease and salvage vehicles, including about 1,000 used electric vehicles in 2025, and Carma and Cars24 Australia sell reconditioned cars online with home delivery. Toyota is the largest brand in the used market with 360,300 sales in 2025, a 15.6% share, and the Ford Ranger is the most traded model.
Companies Covered
Companies covered in the report include:
Recent Market Activity
Table of Contents
Coverage & Segmentation
The study covers the Australia used car market, with 2025 as the base year, 2021 – 2025 as the historical period and 2026 – 2030 as the forecast period. It covers final retail changes of ownership of used passenger cars, SUVs, utes, and vans and light buses, segmented by vehicle type, powertrain, sales channel and state or territory. Values are buyer prices including GST where charged and excluding stamp duty and on-road costs, converted at the 2025 average of AUD 1 = USD 0.6451.
Auction and wholesale trades between businesses, fleet transfers, salvage sales, heavy trucks above 4.5 tonnes, motorcycles, caravans and new and demonstrator vehicles are excluded. The live Marqstats Asia-Pacific Used Car Market report carries Australia at about 2.32 million transactions within its regional total; the present coverage is a dedicated country deep-dive on the same transaction count, and its value should not be added to that regional figure. The live Australia and New Zealand Electric Vehicle Market and Global Used EV Market reports overlap only with the used battery-electric segment.