Market Snapshot
Key Takeaways
Market Overview & Analysis
Report Summary
The China used EV market comprises second-hand passenger vehicles powered by battery-electric or plug-in hybrid drivetrains—reported officially as used new-energy vehicles—resold through franchised and independent dealers, professional superstores, online-to-offline platforms, and cross-border export channels. Valued at an estimated USD 18.88 billion in 2025 on roughly 1.6 million transactions, it is the largest and most liquid used-EV market in the world, and used NEVs now represent 7.9% of a used-car market that surpassed 20 million transactions for the first time in 2025.
The market’s defining characteristic is scale paired with rapid depreciation. Because China has the world’s largest new-energy-vehicle fleet, first-owner churn feeds a deep pool of used supply, and turnover is reinforced by scrappage and trade-in programs and by easing inter-city transfer rules. Yet residual values are punishing: three-year-old EV retention was about 46% in 2024 and average resale values fell to roughly 42% by late 2025, while about 80% of dealers refuse battery-electric vehicles older than five years. Used NEVs skew younger than the overall used mix, which is why they still command higher average ticket values than the market average despite harsher depreciation percentages.
Channels are shifting from fragmented merchant and consumer-to-consumer trading toward professionally reconditioned, cross-regional, superstore-based sales. Cross-regional circulation is improving: the vehicle transfer rate reached 34.9% in December 2025, up 4.7 percentage points year over year, as inter-city rules eased. This professionalization—paired with battery-swap and battery-health ecosystems—is central to building trust in a market where battery condition and technology obsolescence weigh heavily on value.
There is also a distortion factor to weigh. Estimates suggest that “zero-mileage used cars” represented roughly 4% of electric-car sales in 2025, and authorities moved to curb the practice. This means a slice of reported used-EV activity reflects channel management and overcapacity rather than genuine household resale, so the market is both very large and, at the margin, shaped by registration and inventory dynamics that warrant careful interpretation.
Battery health is the pivotal value variable, and China prices it more directly than any other market. Because charging speed, battery chemistry, and software support advance so quickly, buyers and dealers treat battery condition as the primary determinant of a used NEV’s worth, which is why dealer appetite collapses beyond five years. In response, professional platforms are building battery-diagnostics, reconditioning, and battery-swap ecosystems—often in partnership with battery manufacturers—to convert battery condition from a hidden risk into a certified, tradable attribute. Standardized swappable-pack architectures further decouple vehicle age from battery age, offering a route to stabilize residuals on models designed around them. For operators, battery certification and reconditioning capability are becoming the core of used-NEV competitiveness.
Policy and pricing dynamics reinforce the market’s velocity. Scrappage and trade-in programs, together with easing inter-city transfer rules, accelerate turnover and cross-regional flow, while aggressive new-vehicle price competition continually resets the ceiling on used prices. The result is a market that moves enormous volume at compressed margins: value grows more slowly than units because average used-NEV prices are falling even as transactions climb. Operators that add inspection, reconditioning, financing, and cross-regional distribution capture the throughput; those relying on simple buy-and-sell arbitrage face thinning economics.
Market Dynamics
Key Drivers
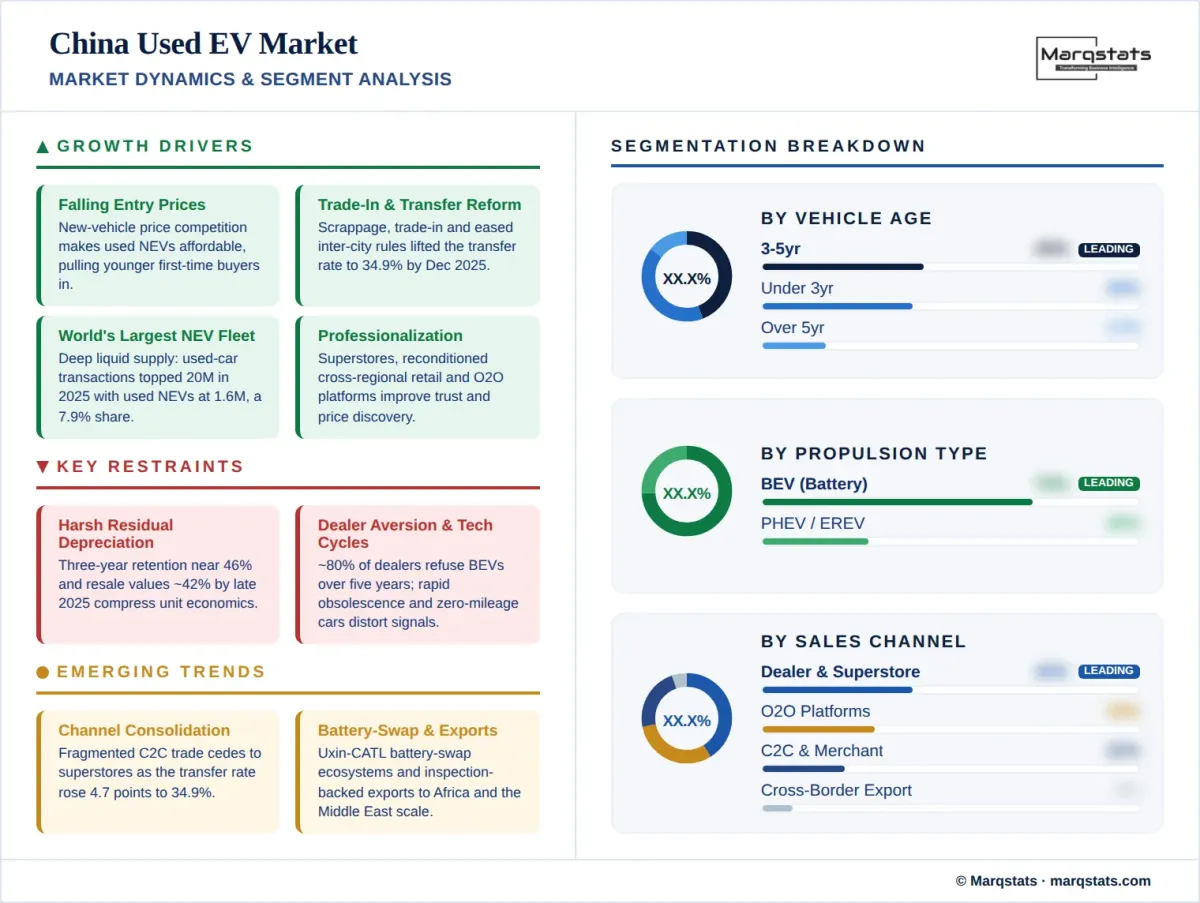
Falling entry prices and new-vehicle price competition make used NEVs increasingly affordable, pulling younger, first-time buyers into the second-hand market.
Trade-in and scrappage policy plus eased inter-city transfer rules boost turnover and cross-regional circulation, lifting the vehicle transfer rate to 34.9% by December 2025.
The world’s largest NEV fleet generates deep, liquid used supply: total used-car transactions topped 20 million in 2025, with used NEVs at 1.6 million, or 7.9% of the market.
Professionalization—superstores, cross-regional reconditioned retail, and online-to-offline platforms—improves condition, trust, and price discovery for used NEVs.
Battery-swap and battery-health ecosystems, including partnerships between used-car platforms and battery makers, reduce battery anxiety and support residual values on younger stock.
Key Restraints
Harsh residual depreciation: three-year-old EV retention of ~46% in 2024 and average resale values near 42% by late 2025 compress unit economics, especially for older vehicles.
Dealer aversion to older stock: roughly 80% of used-car dealers refuse battery-electric vehicles older than five years, capping liquidity to very recent vintages.
Fast technology cycles: rapid battery-chemistry, range, and charging-speed improvements make older NEVs quickly obsolete, resetting used demand.
Zero-mileage “used car” distortion—estimated at ~4% of electric-car sales in 2025—clouds true resale signals and has drawn regulatory crackdowns.
Key Trends
Channels are consolidating from fragmented merchant and consumer-to-consumer trade toward professional superstores and reconditioned cross-regional retail.
Cross-regional circulation is rising as inter-city transfer rules ease, with the transfer rate up 4.7 points to 34.9% in December 2025.
Used plug-in hybrid volume is set to rise quickly because the new-vehicle market has become more PHEV- and extended-range-heavy; official NEV reporting blends both.
Inspection-backed platforms are expanding used-EV exports to emerging markets in Africa and the Middle East, opening a new demand outlet for Chinese used NEVs.
Market Segmentation
Battery-electric vehicles remain the largest share of China’s used NEV volume, reflecting the scale of the country’s BEV fleet. However, BEVs also bear the steepest depreciation and the sharpest dealer aversion beyond five years, so liquidity concentrates in recent vintages with stronger battery health and charging-speed capability.
Plug-in hybrids—together with extended-range electric vehicles—are the fastest-rising part of the used mix because the new-vehicle market has tilted sharply toward plug-in hybrids. Official NEV statistics blend BEV and PHEV, but used plug-in hybrid volume is expected to grow quickly, aided by lower range anxiety and broad appeal in regions with less mature charging. As the 2023–2025 cohorts of plug-in hybrids and extended-range vehicles mature into the second-hand channel, their share of used NEV transactions is set to climb steadily through the forecast period, gradually rebalancing a used mix that has historically been battery-electric-led.
Sub-three-year vehicles account for roughly 27% of the broader used market and an even larger share of used NEVs, which skew young. These vehicles retain the strongest battery health and command the highest ticket values, anchoring professional superstore and platform inventory. Because used NEVs are materially younger than the average used internal-combustion car, this near-new band is where residual-value confidence, financing availability, and warranty coverage are strongest, and it is the primary battleground for certified-retail competition.
Three-to-five-year vehicles sit within the market’s largest age band (three-to-six-year vehicles were about 43% of transactions in late 2025) and remain liquid, but they face rising price sensitivity as they approach the five-year dealer-aversion threshold. Buyers in this band weigh remaining battery warranty, verified state-of-health, and charging-speed capability closely, and certified reconditioning can meaningfully lift both saleability and price for vehicles nearing the threshold.
Vehicles older than five years are the hardest to trade: about 80% of dealers decline to stock battery-electric vehicles beyond this age, so these units migrate toward value channels, lower-tier markets, or export, and depend heavily on battery certification to sell.
Professionally reconditioned dealer and superstore channels are gaining share as the market formalizes, offering inspection, standardized reconditioning, and cross-regional distribution that raise trust and price discovery for used NEVs. Large-format superstores aggregate supply, apply consistent battery and condition grading, and increasingly bundle financing and warranty, positioning them to capture share from fragmented merchants as buyers prioritize certified condition over the lowest headline price.
Online-to-offline platforms combine digital discovery with physical inspection and logistics, improving conversion in a market historically dominated by fragmented merchants. They are central to consumer trust and increasingly to battery-health transparency, using standardized inspection reports, battery diagnostics, and cross-regional fulfillment to match young, certified stock with demand across city tiers—capabilities that are especially valuable given how heavily Chinese buyers weigh verified battery condition.
Traditional consumer-to-consumer and merchant trading still moves substantial volume, particularly for older and lower-value NEVs, but is steadily ceding share to professional channels as buyers prioritize inspection and warranty. This channel remains most relevant in lower-tier cities and for vehicles beyond the five-year dealer-aversion threshold, where price is the dominant consideration and formal reconditioning is scarce.
Cross-border export is an emerging outlet, with inspection-backed platforms shipping used NEVs to Africa and the Middle East, including early corridors into Ghana and Nigeria. Export helps absorb older stock that domestic dealers avoid and extends Chinese scale into lower-income markets, though after-sales support, spare-parts availability, and battery inspection remain constraints that professional platforms are working to standardize.
Urban replacement demand from households upgrading within the NEV ecosystem is the core demand engine, supported by falling entry prices, younger buyers, and rising comfort with used NEVs, tempered by battery-health anxiety.
Fleet, ride-hailing, and mobility-service returns feed a steady stream of higher-mileage NEVs into the used channel, adding volume but requiring careful battery assessment given intensive duty cycles. Because these vehicles accumulate mileage quickly, they concentrate in value channels and export, and their pricing hinges on verified battery state-of-health more than on age alone—making them a natural fit for platforms with strong diagnostics and reconditioning capabilities.
By Geography
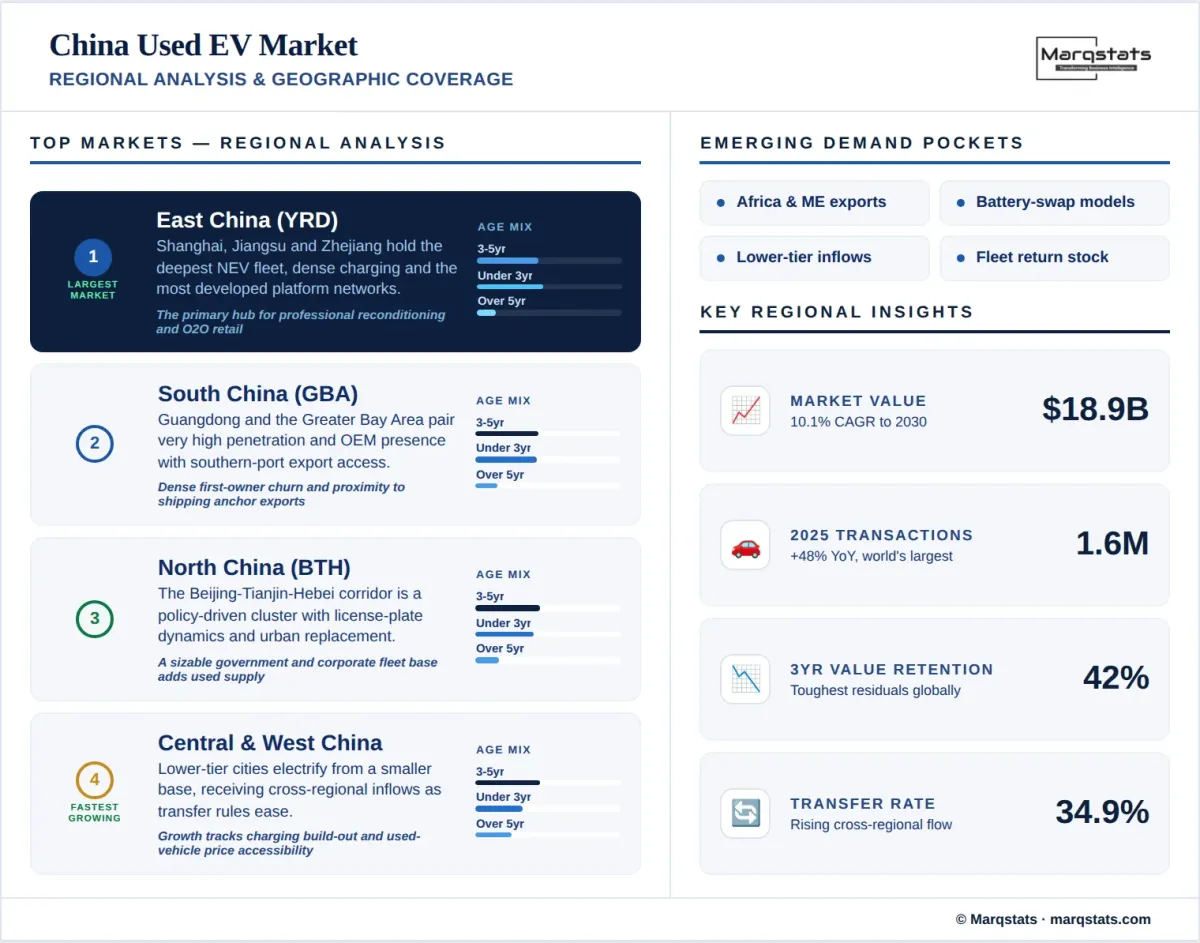
Although this report scopes the national China used EV market, demand and supply are unevenly distributed across the country’s major economic clusters. The shares below are Marqstats directional estimates based on new-energy-vehicle density, charging maturity, and cross-regional circulation.
East China (Yangtze River Delta)
East China—centered on Shanghai, Jiangsu, and Zhejiang—is the largest used-EV cluster, reflecting the deepest NEV fleet, dense charging infrastructure, and the most developed superstore and platform networks. The region combines high household purchasing power with mature fleet and mobility-service operators that feed a steady stream of returns into the used channel, and it is the primary hub for professional reconditioning and online-to-offline retail. Marqstats estimates the region accounts for roughly 34–38% of national used-EV transactions.
South China (Greater Bay Area)
South China, led by Guangdong and the Greater Bay Area, combines very high NEV penetration with strong domestic OEM presence and export access through southern ports. Home to several of the country’s largest new-energy manufacturers, the region benefits from dense first-owner churn, active certified pre-owned and trade-in programs, and proximity to shipping routes that make it the natural hub for used-NEV exports. Marqstats estimates the region accounts for around 22–26% of national used-EV volume.
North China (Beijing-Tianjin-Hebei)
North China, anchored by the Beijing-Tianjin-Hebei corridor, is a large policy-driven cluster with strong incentives, license-plate dynamics, and urban replacement demand that channel buyers toward new-energy vehicles. A sizable government and corporate fleet base adds to used supply as those vehicles cycle out. Marqstats estimates the region represents roughly 16–20% of national used-EV transactions.
Central & Western China
Central and Western China is the fastest-growing grouping, receiving cross-regional inflows of used NEVs from coastal markets as inter-city transfer rules ease and lower-tier cities electrify from a smaller base. The region is estimated at about 20–24% of national volume, with growth tracking charging build-out and price accessibility.
How Competition Is Evolving
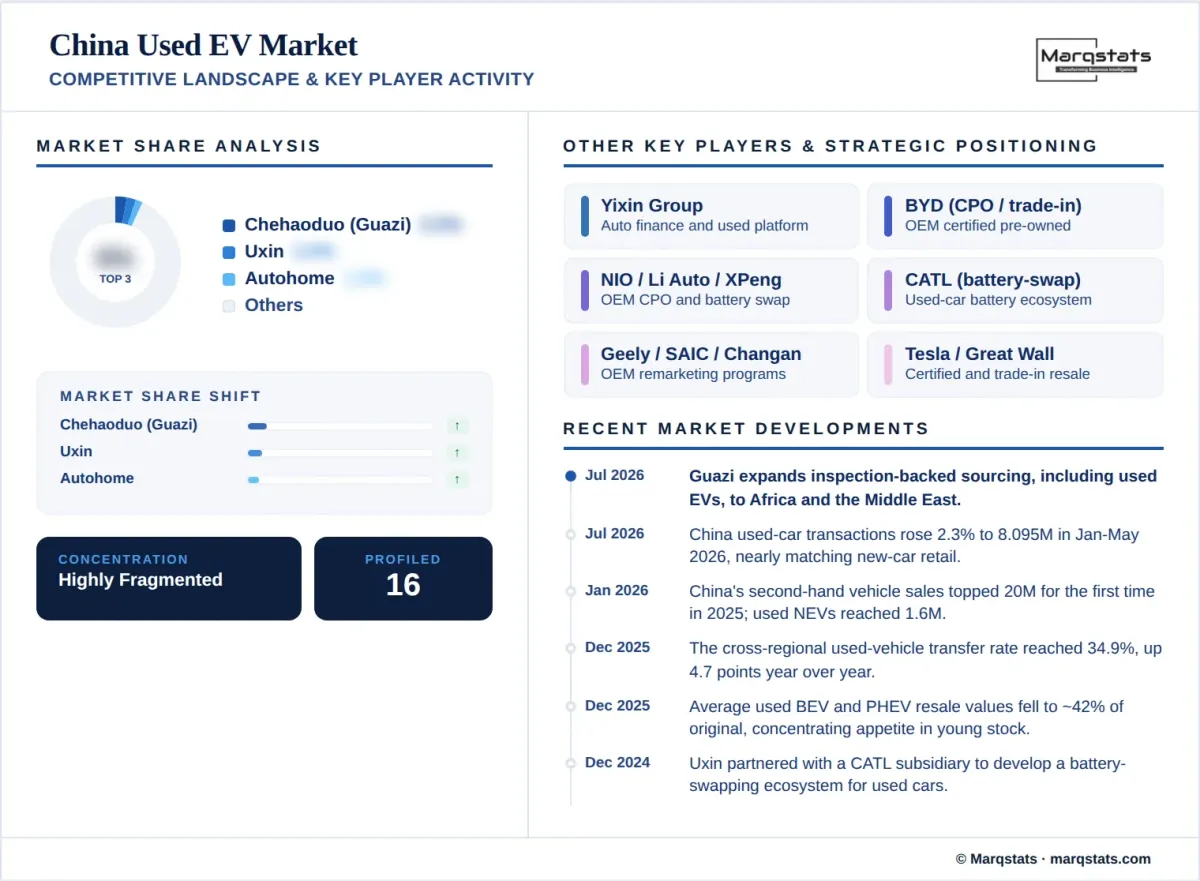
The China used EV market is highly fragmented and rapidly professionalizing. Historically dominated by independent merchants and consumer-to-consumer trade, it is consolidating toward listed platforms, professional superstores, and online-to-offline retailers, alongside new-energy OEM certified pre-owned and trade-in programs. Even the largest listed specialist holds only a low-single-digit fraction of the total market—one such retailer sold 57,408 vehicles in 2025, including 51,110 retail units, for roughly 0.3% of China’s used-car market—underscoring how open the competitive field remains.
Competitive advantage is shifting toward operators that can combine sourcing scale, standardized reconditioning, cross-regional logistics, battery diagnostics, and financing. Battery condition is the decisive trust variable, and partnerships between used-car platforms and battery makers are building battery-swap and battery-health ecosystems that directly address depreciation anxiety. Because battery health, charging speed, and software support are priced far more directly than in Western markets, inspection and certification capability is a core differentiator.
New-energy manufacturers are increasingly active in the used channel through certified pre-owned and trade-in programs that recycle first-owner vehicles into the second-hand market, defend residuals, and retain customers within their ecosystems. Meanwhile, inspection-backed platforms are opening export corridors to Africa and the Middle East. Because manufacturer- and channel-specific used-NEV shares are rarely disclosed, competitive position is best read through vehicle throughput, professional-retail share, and reconditioning capability rather than published EV-only rankings.
Companies Covered
The report profiles 16++ companies with full strategy and financials analysis, including:
Recent Market Activity
Table of Contents
Coverage & Segmentation
This report provides a comprehensive analysis of the China used EV market for the historical period 2021–2025, with 2025 as the base year and a 2026–2030 forecast period. A used EV is defined as a second-hand passenger vehicle powered by a battery-electric or plug-in hybrid drivetrain, reported officially as a used new-energy vehicle, and the market is quantified in gross transaction value (USD billion, converted from renminbi at prevailing mid-2026 rates) with unit volume as a validation metric. Coverage spans market sizing and forecasts, segmentation by propulsion type, vehicle age, sales channel, and demand source, regional demand across China’s major economic clusters, competitive structure, and the residual-value, battery-health, policy, and channel factors shaping the market.
The analysis integrates supply-side drivers—first-owner churn from the world’s largest NEV fleet, fleet and mobility returns, and trade-in policy—with demand-side drivers such as affordability, younger buyers, and battery-health confidence. It examines the market’s high-liquidity, high-depreciation structure, the professionalization of channels, cross-regional circulation, the zero-mileage distortion, and the emergence of used-NEV exports, and it provides an operating framework for sourcing, reconditioning, battery certification, and channel strategy.