Market Snapshot
Key Takeaways
Market Overview & Analysis
Report Summary
Indonesia is building a battery industry from the ore upward rather than from the vehicle backward, and the sequence matters for how the market should be read. Nickel processing capacity is operational or committed, cell manufacturing is under construction, and the precursor and cathode stages between them barely exist. A country with world-scale nickel reserves currently ships intermediate product out and brings finished cells back in.
The measure is batteries manufactured in Indonesia plus batteries supplied into Indonesia inside or for electrified vehicles, each unit of value counted once at the point it enters the chain. A domestically made cell fitted to a domestically built vehicle sits in manufacture and is removed from imported supply, so the two categories never double count. Capacity exported after manufacture remains in scope, because the pack definition covers battery exports and because export is where committed capacity exceeds domestic demand.
The analysis is written for cell and materials investors weighing the precursor gap, nickel processors choosing between intermediate export and downstream integration, manufacturers planning against local content thresholds that tighten in January 2027, and investors who need announced capacity separated from commissioned capacity before any figure is read.
Indonesia EV Battery Market Size and Forecast
Battery value entering the Indonesian chain is estimated at USD 392.35 million in 2025 and USD 1,349.28 million by 2030, an increase of USD 956.93 million on 14.61 additional GWh. Capacity moves from 4.13 to 18.74 GWh at 35.32%, while capacity-linked pricing falls from an estimated USD 95 to USD 72 per kWh, a decline of 24.21%.
Value compounds 7.30 points below capacity at 28.02% against 35.32%, and the mechanism here is cell price rather than product mix. This is the fourth Indonesian panel in this catalogue to invert that way, after the hybrid, plug-in hybrid and electric commercial vehicle segments, and it is the only one where falling unit price rather than changing vehicle mix explains it.
The 2025 split is the finding the rest of the page rests on. Of 4.13 GWh entering the chain, an estimated 0.20 GWh was domestically manufactured and an estimated 3.93 GWh was imported inside or for vehicles. By 2030 an estimated 14.00 GWh is domestically manufactured against an estimated 4.74 GWh imported, which reverses the ratio rather than adjusting it.
Roughly 4.60 GWh of the 2030 figure is capacity manufactured for export rather than for domestic fitment, which had no measurable equivalent in 2025. Battery and component exports were scheduled to begin in the second half of 2026 from one manufacturer, described as the first subsidiary of its group in Southeast Asia to do so, and the integrated Karawang plant is sized well above Indonesian vehicle demand.
The Chain Has a Hole in the Middle
The investment ministry has put the position plainly: high pressure acid leach capacity exists, cell manufacturing is near, and precursor cathode active material and cathode production are the missing links. That is not a forecast but a description of committed assets, and it defines where the next investment decision has to land.
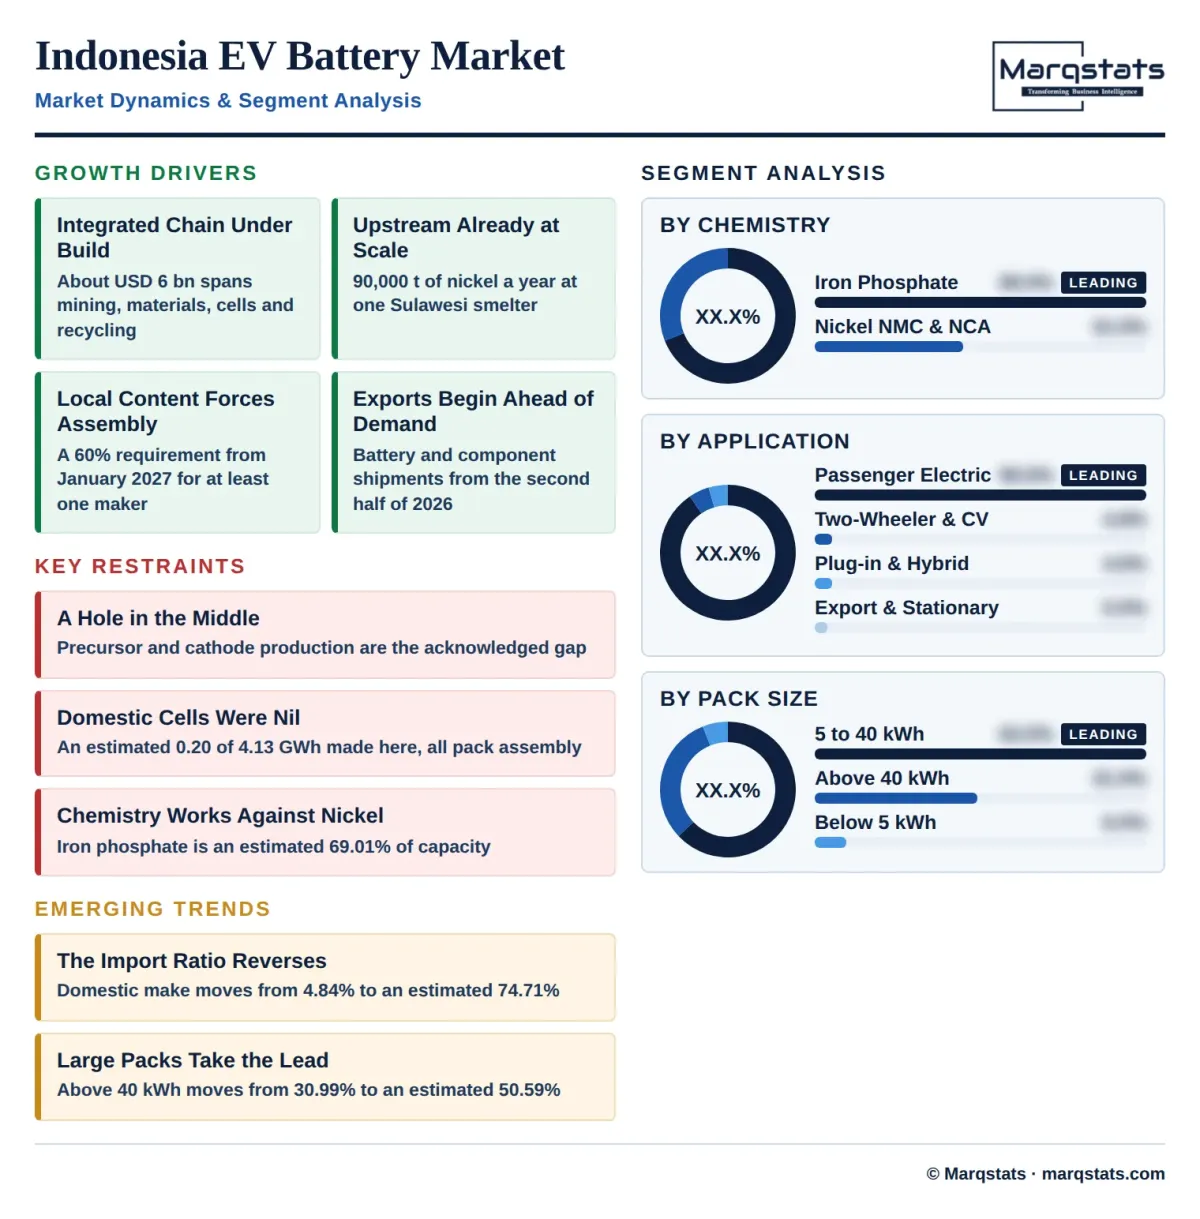
Upstream is the most advanced stage. The Bahodopi smelter in Sulawesi is rated at 90,000 tons of nickel a year across three 30,000-ton autoclave reactors, of which two had been delivered by August 2026 with the third due in September, targeting trial production by the end of 2026 and full operation in the second quarter of 2027. A separate nickel and cobalt mixed hydroxide project is scheduled to produce from 2027 with Japanese, Korean and Australian participation alongside Indonesian partners.
Downstream is under construction rather than operating. The integrated Karawang facility broke ground in June 2025 on a project of roughly USD 6 billion spanning mining, processing, materials, manufacturing and recycling, with a first-phase cell plant rated at 6.9 GWh and production scheduled for late 2026. The energy ministry expected two nickel-based battery plants to be operational during 2026.
The gap between them is a single announced project. A precursor cathode active material plant of around USD 350 million, which would process mixed hydroxide precipitate from the HPAL facilities, was outlined in July 2026 as the first in Indonesia. Until it is built, Indonesian mixed hydroxide precipitate leaves the country to be converted into cathode material elsewhere and returns inside imported cells.
Indonesia Mines Nickel and Its Cars Run on Iron Phosphate
The chemistry split is the sharpest tension on this page. Lithium iron phosphate accounted for an estimated 69.01% of capacity entering the Indonesian chain in 2025 and remains an estimated 65.10% by 2030, in a country whose entire upstream investment case is nickel.
The model evidence is unambiguous. Every locally assembled or newly launched battery electric model named in the current cycle uses lithium iron phosphate, including the Subang-built Atto 1 at 30.08 kWh for the Standard and Dynamic grades and 38.88 kWh for the Premium, the Cikarang-built Aira ev at 16.2 kWh and 25.1 kWh, and the Eksion at 69.2 kWh in battery electric form and 20.5 kWh as a plug-in hybrid. Electric scooters use two 1.5 kWh lithium iron phosphate swap packs.
Nickel-based chemistry therefore grows faster than the market it sits in, at 38.57% against 33.75% for lithium iron phosphate, but it grows into export and into larger packs rather than into the domestic volume fleet. Packs above 40 kWh move from an estimated 30.99% of capacity to an estimated 50.59%, and that band is where nickel chemistry competes.
The commercial consequence is that Indonesia's nickel chain and Indonesia's vehicle market are serving different customers. A nickel processor sizing demand off domestic electric vehicle sales will misread the opportunity, because the buyer for Indonesian nickel units is an export cell line rather than an Indonesian assembly plant.
Local Content Is the Forcing Function
This segment moves on local content thresholds rather than on purchase incentives. One manufacturer stated in September 2026 that it can meet a 60% requirement from January 2027 following its Subang factory inauguration, and said it plans to add battery-related assembly in Indonesia specifically to raise domestic content. Another targets up to 60% by 2027 through knocked-down assembly.
Current levels are below those targets and published. One model reports 46.5% domestic content using cells from a Chinese supplier, which is the clearest disclosed benchmark in the market. Capacity at 40% to 60% local content moves from an estimated 20.10% of the total to an estimated 28.82%, while capacity above 60% moves from nil to an estimated 59.45%, with no compound rate published for that series because the base is nil.
Pack assembly came first and cell manufacture follows. One manufacturer described itself in July 2026 as the first Chinese automaker to assemble electric vehicle batteries locally, having produced 200,000 vehicles in Indonesia since 2017 including 10,000 exported to 22 countries with export growth of 119% year on year. Another committed IDR 1.3 trillion to move from pack assembly into cell and module production, against cumulative Indonesian investment of around IDR 100 trillion over more than five decades.
Capability transfer is running ahead of capacity. Hundreds of technicians and engineers were trained at one manufacturer's research centre in China during 2025, and a separate memorandum signed in January 2026 covers research into intelligent chassis models built for localised production. A vehicle plant at Subang covering 171 hectares with planned investment above USD 1 billion was inaugurated in December 2025.
Market Dynamics
Key Drivers
- An integrated project of roughly USD 6 billion spans mining through recycling, with a 6.9 GWh first-phase cell plant at Karawang and production scheduled for late 2026.
- Upstream nickel capacity of 90,000 tons a year at one Sulawesi smelter is described as sufficient for approximately 2 million electric vehicles annually.
- Local content requirements tighten to 60% from January 2027 for at least one manufacturer, forcing battery-related assembly into the country.
- Battery and component exports were scheduled to begin in the second half of 2026, from the first subsidiary of its group in Southeast Asia to do so.
- Recycling is designed into the chain from the start, targeting metal recovery above 95% and output of 142,000 tons of nickel and 30,000 tons of cathode materials a year.
Key Restraints
- Precursor cathode active material and cathode production are the acknowledged missing links, with a single announced plant of around USD 350 million proposed to fill them.
- Domestic cell manufacture was effectively nil in the base year, with an estimated 0.20 GWh of 4.13 GWh locally produced and that entirely pack assembly.
- The dominant chemistry in Indonesian vehicles is lithium iron phosphate at an estimated 69.01% of capacity, which does not consume Indonesian nickel.
- Announced upstream capacity for approximately 2 million vehicles a year sits against Indonesian battery electric passenger car sales of 103,931 units in 2025.
Key Trends
- Domestically manufactured capacity moves from an estimated 4.84% of the total to an estimated 74.71%, reversing the import ratio rather than adjusting it.
- Capacity above 60% local content moves from nil to an estimated 59.45% of the total as the January 2027 threshold takes effect.
- Packs above 40 kWh move from an estimated 30.99% of capacity to an estimated 50.59%, which is where nickel chemistry competes against iron phosphate.
- Export and stationary capacity moves from nil to an estimated 4.60 GWh, 24.55% of the 2030 total, as committed plant capacity exceeds domestic demand.
Market Segmentation
Lithium iron phosphate accounted for an estimated 2.85 GWh in 2025, 69.01% of capacity, reaching an estimated 12.20 GWh or 65.10% by 2030 at a 33.75% compound rate. Every locally assembled or newly launched battery electric model in the current cycle uses it, from the 16.2 kWh Aira ev to the 69.2 kWh Eksion, as do electric scooters running two 1.5 kWh swap packs.
Nickel-based chemistry accounted for an estimated 1.28 GWh in 2025, 30.99% of capacity, reaching an estimated 6.54 GWh or 34.90% by 2030 at a 38.57% compound rate, the faster of the two. It grows into export volume and larger packs rather than into the domestic volume fleet, which is the chemistry paradox at the centre of the Indonesian chain.
Passenger battery electric vehicles accounted for an estimated 3.74 GWh in 2025, 90.56% of capacity, reaching an estimated 11.70 GWh or 62.43% by 2030 at a 25.62% compound rate. The application rests on 103,931 battery electric passenger cars sold in 2025 at pack sizes ranging from 16.2 kWh to 69.2 kWh.
Plug-in and full hybrids accounted for an estimated 0.19 GWh in 2025, 4.60% of capacity, reaching an estimated 1.28 GWh or 6.83% by 2030 at a 46.45% compound rate. Hybrid packs are small, at roughly 1.3 kWh, but volume is large at 65,943 units, while plug-in packs such as the 20.5 kWh Eksion are an order of magnitude bigger on far lower volume at 5,134 units.
Two-wheelers and commercial vehicles accounted for an estimated 0.20 GWh in 2025, 4.84% of capacity, reaching an estimated 1.16 GWh or 6.19% by 2030 at a 42.13% compound rate. Electric scooters carry two 1.5 kWh packs each across 55,059 units, while electric commercial vehicles carry the largest packs in the market across only an estimated 195 units.
Export and stationary applications had no measurable capacity in 2025, reaching an estimated 4.60 GWh or 24.55% by 2030, with no compound rate published because the base is nil. Battery and component exports were scheduled to begin in the second half of 2026, and the integrated Karawang plant is sized above Indonesian vehicle demand at 6.9 GWh in its first phase alone.
Domestically manufactured capacity was an estimated 0.20 GWh in 2025, 4.84% of the total, reaching an estimated 14.00 GWh or 74.71% by 2030. No compound rate is published because a base of 0.20 GWh makes the rate a property of the denominator. The 2025 figure is pack assembly alone, with cells imported, since the integrated cell plant was scheduled to produce only from late 2026.
Imported capacity was an estimated 3.93 GWh in 2025, 95.16% of the total, reaching an estimated 4.74 GWh or 25.29% by 2030 at a 3.82% compound rate, nearly flat in absolute terms while falling to a quarter of the market by share. One model launched in 2026 was imported complete with its battery, at 100 units allocated against 132 reservations.
Packs below 5 kWh accounted for an estimated 0.25 GWh in 2025, 6.05% of capacity, reaching an estimated 1.06 GWh or 5.66% by 2030 at a 33.50% compound rate. The band covers hybrid packs at roughly 1.3 kWh and the two 1.5 kWh swap packs fitted to each electric scooter, and it carries the highest unit count and the lowest energy share.
Packs between 5 kWh and 40 kWh accounted for an estimated 2.60 GWh in 2025, 62.95% of capacity, reaching an estimated 8.20 GWh or 43.76% by 2030 at a 25.83% compound rate. The band holds the entry battery electric fleet, including the 16.2 kWh and 25.1 kWh Aira ev, the 30.08 kWh Atto 1 Standard and Dynamic and the 38.88 kWh Premium, and the 20.5 kWh Eksion plug-in hybrid.
Packs above 40 kWh accounted for an estimated 1.28 GWh in 2025, 30.99% of capacity, reaching an estimated 9.48 GWh or 50.59% by 2030 at a 49.25% compound rate, the fastest band and the largest by 2030. The 69.2 kWh Eksion battery electric variant and commercial vehicle packs sit here, and this is where nickel-based chemistry competes.
Capacity below 40% local content accounted for an estimated 3.30 GWh in 2025, 79.90% of the total, falling to an estimated 2.20 GWh or 11.74% by 2030 at a negative 7.79% compound rate, the only declining series on the page. It is the imported-cell position that the January 2027 threshold is designed to end.
Capacity at 40% to 60% local content accounted for an estimated 0.83 GWh in 2025, 20.10% of the total, reaching an estimated 5.40 GWh or 28.82% by 2030 at a 45.43% compound rate. One model reporting 46.5% domestic content with cells from a Chinese supplier is the clearest published benchmark in this band.
Capacity above 60% local content had no measurable position in 2025, reaching an estimated 11.14 GWh or 59.45% by 2030, with no compound rate published because the base is nil. One manufacturer stated in September 2026 that it can meet a 60% requirement from January 2027, and another targets up to 60% by 2027 through knocked-down assembly.
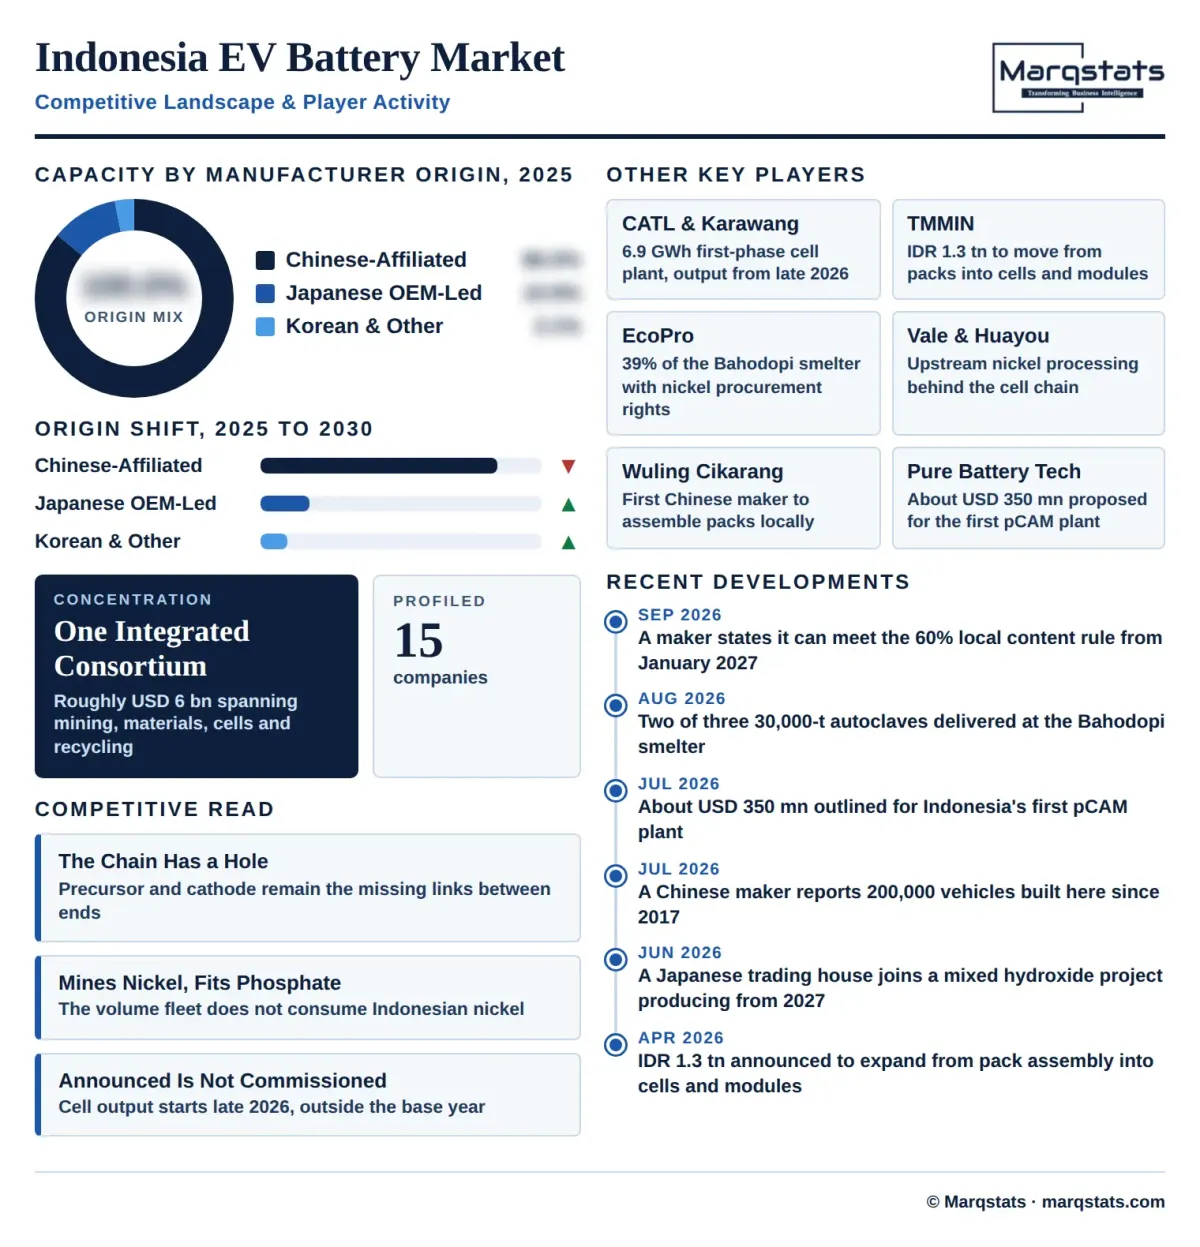
Chinese-affiliated capacity accounted for an estimated 3.55 GWh in 2025, 85.96% of the total, reaching an estimated 14.20 GWh or 75.77% by 2030 at a 31.95% compound rate. The group covers the integrated Karawang project, a cell supplier to one locally assembled model, a joint venture signed in February 2026 with the state mining company and the national battery corporation, and the pack assembly operation at Cikarang.
Japanese manufacturer-led capacity accounted for an estimated 0.45 GWh in 2025, 10.90% of the total, reaching an estimated 2.90 GWh or 15.47% by 2030 at a 45.16% compound rate. It rests on hybrid pack assembly at Karawang moving into cell and module production on IDR 1.3 trillion of committed investment, with exports scheduled from the second half of 2026.
Korean and other capacity accounted for an estimated 0.13 GWh in 2025, 3.15% of the total, reaching an estimated 1.64 GWh or 8.75% by 2030 at a 66.03% compound rate, the fastest origin group. The position is upstream rather than in cells, held through a 39% stake in the Bahodopi smelter with procurement rights to 36,000 tons of nickel a year, and through participation in a separate mixed hydroxide project.
By Geography
West Java and Banten
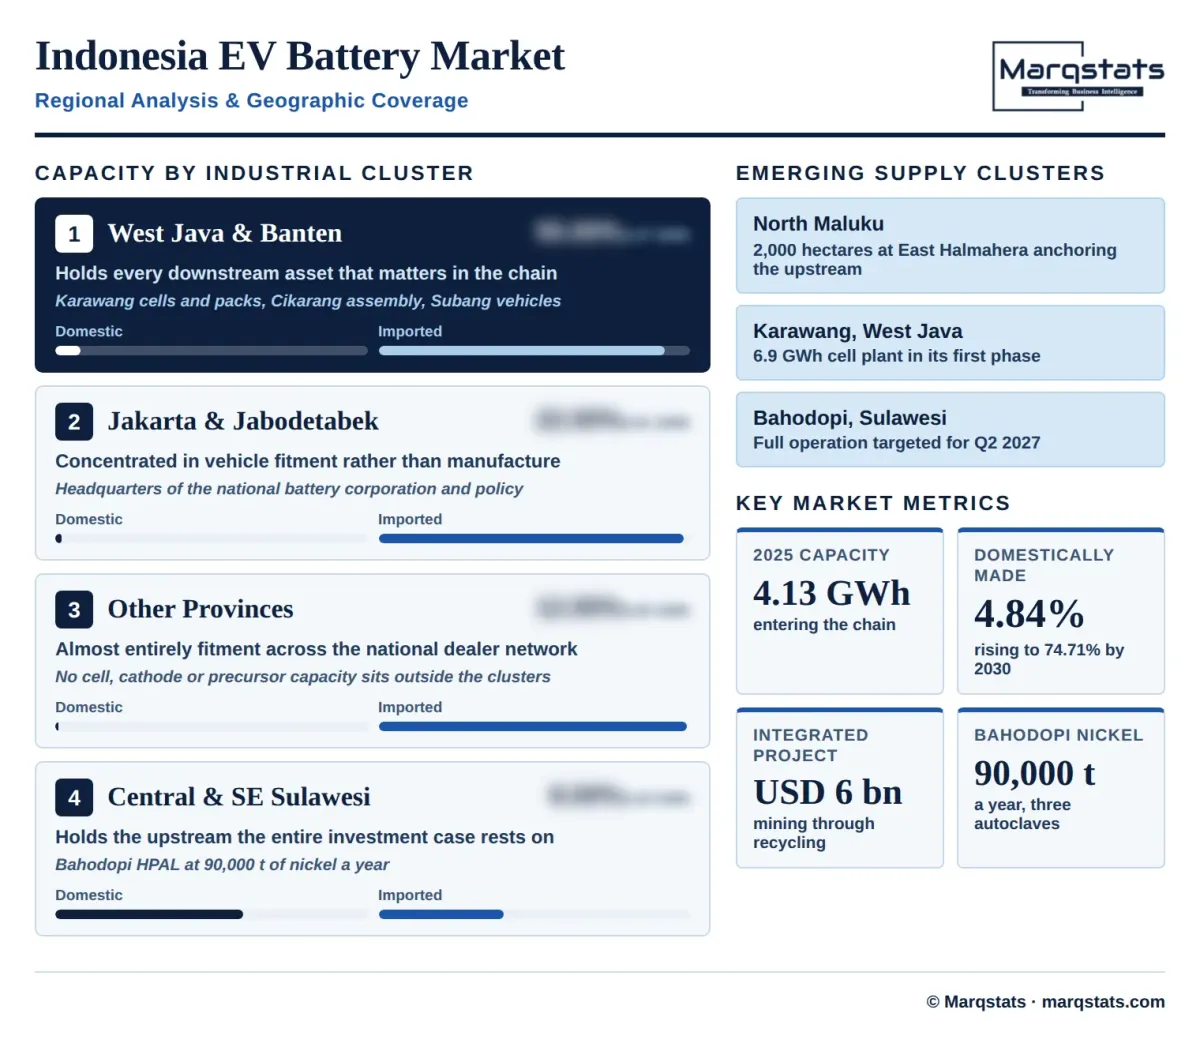
West Java and Banten account for an estimated 2.27 GWh in 2025, 55.00% of capacity entering the chain, and hold every downstream asset that matters. The integrated cell plant sits at Karawang, hybrid pack assembly at Karawang, vehicle and pack assembly at Cikarang, and a 171 hectare vehicle plant at Subang inaugurated in December 2025 on planned investment above USD 1 billion.
Jakarta and Greater Jabodetabek
Jakarta and the surrounding metropolitan area account for an estimated 0.91 GWh, 22.00% of capacity, concentrated in vehicle fitment rather than manufacture. The national battery corporation, jointly owned by four state enterprises at 25% each, is headquartered here, as is the policy machinery that sets local content thresholds and regulates nickel supply.
Other Provinces
Other provinces account for an estimated 0.50 GWh, 12.00% of capacity, almost entirely vehicle fitment distributed across the national dealer network. No cell, cathode or precursor capacity sits outside the three named production clusters, which is itself a finding about how concentrated this chain is.
Central and Southeast Sulawesi
Central and Southeast Sulawesi account for an estimated 0.33 GWh, 8.00% of capacity, and hold the upstream that the entire investment case rests on. The Bahodopi HPAL smelter at 90,000 tons of nickel a year is here, with three 30,000-ton autoclaves and full operation targeted for the second quarter of 2027.
North Maluku
North Maluku accounts for an estimated 0.12 GWh, 3.00% of capacity, and is the smallest position by energy while carrying the largest land commitment. A 2,000 hectare industrial footprint at East Halmahera anchors the upstream half of the integrated project, covering nickel mining, processing and the recycling operation targeting 142,000 tons of nickel a year.
How Competition Is Evolving
One consortium dominates this market and it is vertically integrated by design. The integrated project carries roughly USD 6 billion across nickel mining and processing, materials production, cell manufacturing at Karawang and recycling, partnered with the national battery corporation whose four state shareholders each hold 25%, and with the state mining company. Its recycling arm targets metal recovery above 95% and annual output of 142,000 tons of nickel and 30,000 tons of cathode materials.
The upstream is more contested than the cell stage. The Bahodopi smelter is held by a Korean materials group at 39% alongside an Indonesian mining company and a Chinese recycler, with the Korean partner holding procurement rights to 36,000 tons of nickel a year against total rights of 65,000 tons including 29,000 tons already secured. A separate mixed hydroxide project scheduled to produce from 2027 draws in Japanese, Australian and Korean participants alongside Indonesian partners.
Manufacturer-led activity runs on a different logic from the merchant cell business. One Japanese group is moving from hybrid pack assembly at Karawang into cell and module production on IDR 1.3 trillion, with exports scheduled from the second half of 2026 and cumulative Indonesian investment of around IDR 100 trillion behind it. One Chinese manufacturer assembles packs at Cikarang and has produced 200,000 vehicles in Indonesia since 2017, and another commits to 60% local content from January 2027. A third relies on an external Chinese cell supplier at 46.5% domestic content.
Companies Covered
The report profiles 15+ companies with full strategy and financials analysis, including:
Recent Market Activity
Table of Contents
Coverage & Segmentation
The analysis measures the value of automotive battery capacity entering the Indonesian chain from 2021 to 2030, with 2025 as the base year and 2026 to 2030 as the forecast period, covering nickel processing and mixed hydroxide precipitate, precursor cathode active material and cathode production, cell, module and pack manufacturing, manufacturer in-country battery assembly and battery exports, together with the local content and nickel supply policies that shape investment. Batteries manufactured in Indonesia and batteries supplied into Indonesia are each counted once at the point of entry to the chain, so a domestically made cell fitted to a domestically built vehicle sits in manufacture and is removed from imported supply. Stationary storage outside the battery chain, consumer electronics cells and lead-acid starter batteries are excluded. Values are expressed in USD at a disclosed constant IDR 16,800 per USD.
Coverage spans two chemistries, four applications, two sources, three pack size bands, three local content bands and three manufacturer origin groups, with five regional clusters analysed on capacity entering the chain. Capacity is carried as the energy series at 4.13 GWh in 2025 and capacity-linked pricing as a derived series at USD 95 per kWh, and both are published alongside the value panel because a market whose unit price falls 24.21% while energy multiplies cannot be represented by either alone. Fifteen entities are profiled across cell manufacturers, nickel processors, materials producers, vehicle manufacturers and state enterprises.