Market Snapshot
The India fleet management software market is valued at USD 110.00 million (INR 957.00 crore) in 2025 and is forecast to reach USD 320.00 million (INR 2,784.00 crore) by 2030, a CAGR of 23.81%. Paid software subscriptions rise from 2.75 million commercial vehicles to 6.40 million, an 18.40% volume CAGR, while blended annual software revenue per vehicle moves from USD 40.00 to USD 50.00. The market is the recurring software layer only; devices and installation sit outside it.
Marqstats sizes this market as paid subscriptions multiplied by blended annual software revenue per vehicle, since no Indian registry or ministry publishes fleet software billings. The subscription count is a Marqstats construction triangulated from company disclosures: BlackBuck Limited reported 356,050 average monthly active telematics devices in Fiscal 2024 and 390,088 in the quarter to June 2024, Fleetx reported annual recurring revenue above INR 100 crore in May 2025, and Tata Motors reports more than one million trucks and buses on Fleet Edge. The estimate is most sensitive to the per-vehicle price: every USD 1.00 change in blended revenue per vehicle moves the 2025 value by USD 2.75 million.
The market has two populations that rarely meet. Private fleet platforms bill operators for fuel, trip and driver data on roughly 2.75 million vehicles, yet when the Supreme Court of India heard S. Rajaseekaran v. Union of India in May 2026 it noted that fewer than 1% of transport vehicles carried the statutory tracking device. The statutory and commercial stacks have been built in parallel. Merging them is where the next five years of growth comes from.
Price drift is modest and deliberate. Blended revenue per vehicle grows at 4.56% a year, which means close to four-fifths of value growth is new vehicles coming onto paid plans rather than price increases. Most of the price lift comes from mix, as operators move from INR 150 to INR 250 a month compliance plans to CAN-bus and video tiers priced well above that.
Key Takeaways
Market Overview & Analysis
Report Summary
The India fleet management software market covers the recurring software that commercial fleet operators pay for: tracking and compliance dashboards, CAN-bus fuel and engine analytics, trip and dispatch workflows, video safety and driver monitoring, and the APIs that feed this data into transport management systems. Marqstats values it at USD 110.00 million in 2025 and USD 320.00 million in 2030. Hardware such as vehicle location tracking devices, telematics control units, fuel sensors and dashcams is excluded, as are installation, cellular data sold separately and general enterprise resource planning licences.
The central question for this market is whether the statutory tracking regime and the commercial software market converge. For seven years they ran on separate rails. Rule 125H of the Central Motor Vehicles Rules, 1989 has required AIS-140 vehicle location tracking devices and panic buttons on public service vehicles registered from 1 January 2019, and the Central Motor Vehicles (Fourteenth Amendment) Rules, 2018 attached FASTag and AIS-140 tracking conditions to national-permit goods vehicles. Compliance stayed low. On 12 May 2026 the Supreme Court directed that no public service vehicle receive a fitness certificate or permit without a verified tracking device and panic button reflected in VAHAN. That direction turns a one-time device purchase into a recurring data obligation, and recurring data obligations are what fleet software vendors sell.
The forecast is a single trajectory. Marqstats expects paid subscriptions to compound at 18.40% and blended software revenue per vehicle at 4.56%, producing the 23.81% value CAGR. The main risk to that path is enforcement pace across states rather than demand, since 19 States and Union Territories had commissioned monitoring centres by February 2026 according to a Lok Sabha reply cited on the Marqstats India CV Telematics Fleet Safety page.
India Fleet Management Software Market Size and Forecast
Marqstats estimates the market at USD 42.50 million in 2021, USD 55.02 million in 2022, USD 71.04 million in 2023, USD 89.32 million in 2024 and USD 110.00 million in 2025, a historical CAGR of 26.84%. The forecast runs to USD 136.17 million in 2026, USD 168.63 million in 2027, USD 208.85 million in 2028, USD 258.53 million in 2029 and USD 320.00 million in 2030. In rupees, at the fixed 2025 average of INR 87.00 per US dollar, that is INR 957.00 crore in 2025 rising to INR 2,784.00 crore in 2030.
The volume series behind those values is 1.25 million paid subscriptions in 2021, 1.55 million in 2022, 1.92 million in 2023, 2.32 million in 2024 and 2.75 million in 2025, rising to 3.25 million in 2026, 3.85 million in 2027, 4.57 million in 2028, 5.42 million in 2029 and 6.40 million in 2030. Blended annual software revenue per vehicle moves from USD 34.00 in 2021 to USD 40.00 in 2025 (INR 3,480, or INR 290 a month) and USD 50.00 in 2030 (INR 4,350, or about INR 363 a month).
Growth slowed from 29.46% in 2022 to 23.15% in 2025 as the early wave of large logistics companies finished digitising. It holds near 23.8% a year through the forecast because two new sources of subscriptions arrive together. Public service vehicles now need a verified, VAHAN-linked device for fitness and permits, and manufacturers are being pushed toward pre-fitted tracking. Both convert hardware that used to sit idle after inspection into a billable data stream.
Sensitivity is concentrated in price, not volume. A USD 1.00 change in blended revenue per vehicle shifts the 2025 value by USD 2.75 million and the 2030 value by USD 6.40 million. A 100,000-vehicle change in the 2025 subscription base shifts value by USD 4.00 million. Marqstats treats the subscription count as the firmer of the two inputs because three listed or company-reported anchors bound it.
Two Tracking Stacks Explain Why Under 1% Compliance and 2.75 Million Subscriptions Both Hold
Two numbers about Indian fleet tracking look contradictory. Marqstats counts about 2.75 million commercial vehicles on paid fleet software in 2025, while the Supreme Court observed in May 2026 that fewer than 1% of transport vehicles carried the mandated device. Both can be true only if they measure different things, and they do.
The Court was looking at statutory compliance: an AIS-140 device that is registered in VAHAN and reports to a state command and control centre. The commercial market is a different stack. A transporter in Namakkal or Bhiwandi buys a tracker or uses the factory unit on a Tata or Eicher truck, pays a monthly fee to a fleet platform, and watches fuel and trip data on a phone. None of that reaches the state. BlackBuck Limited alone averaged 356,050 active telematics devices in Fiscal 2024, and none of those needed to be AIS-140 certified for the operator to pay.
Against roughly 12.5 million trucks in India as of Fiscal 2024, as cited in the Zinka Logistics Solutions offer documents, the 2025 goods-vehicle subscription base of about 2.34 million, 85% of all subscriptions, equals around 19% of trucks. That is a Marqstats construction. It sits far above statutory compliance and leaves four in five trucks still unsubscribed.
The consequence for vendors is direct. A platform that can push its location feed into VAHAN, as fleet platforms began doing in 2026, sells the compliance proof and the operating analytics in one subscription. Marqstats expects the compliance tier to be bundled inside operational plans rather than bought alone, which is why compliance and basic tracking grows at only 13.66% while the total grows at 23.81%.
The Fleet Software Layer Is About 12% of the Commercial Vehicle Telematics Stack
Fleet software is the thin, recurring layer of a much larger hardware-led stack. The Marqstats India CV Telematics Fleet Safety page sizes the full commercial vehicle stack, including AIS-140 hardware, OEM platforms, fleet software, video telematics, connectivity and ADAS-linked electronics, at USD 0.92 billion in 2025 and USD 2.88 billion in 2030. The software layer sized here is 11.96% of that stack in 2025 and 11.11% in 2030.
The share falls slightly because hardware grows quickly in the same window: cameras, radar and driver-monitoring units are expensive to fit and the regulatory push for automatic braking and drowsiness detection lands first on hardware bills. Software catches up later, once the fitted base is large enough to subscribe. Investors reading the two pages together should treat them as nested, not additive.
Market Dynamics
Key Drivers
Four forces convert installed hardware into paid software, and each is tied to a dated instrument or a disclosed company figure.
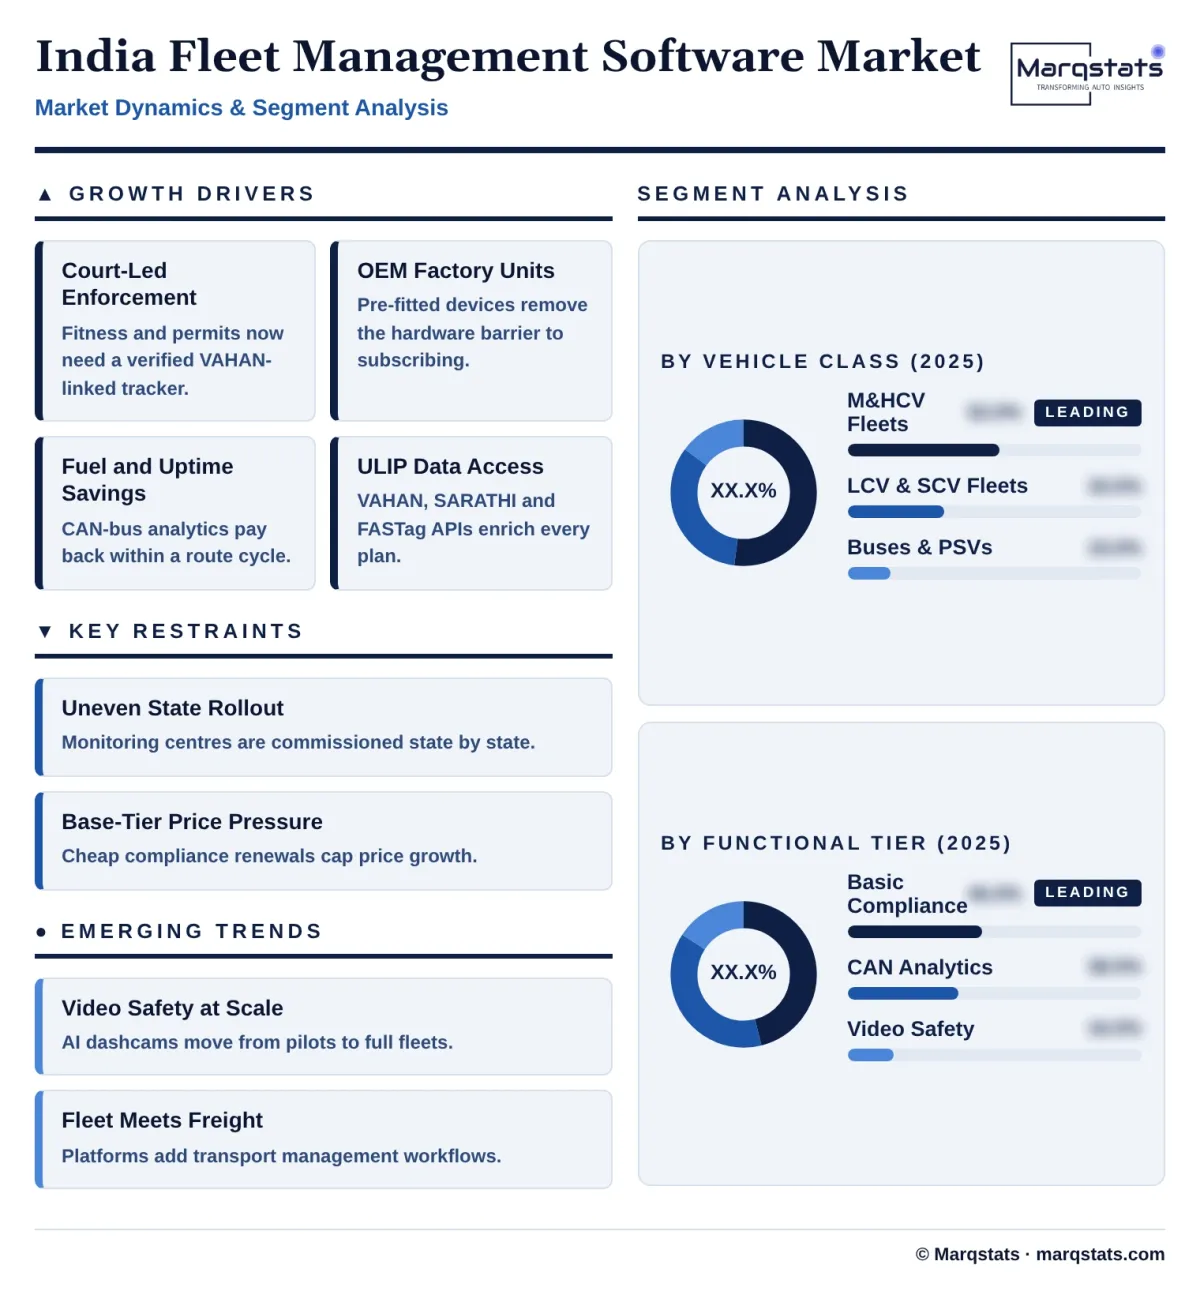
- Supreme Court enforcement of Rule 125H: the 12 May 2026 order in S. Rajaseekaran v. Union of India bars fitness certificates and permits for public service vehicles without a verified tracking device and panic button reflected in VAHAN, and directs retrofitting of vehicles registered up to December 2018. Because the verification is continuous rather than a one-time inspection, it creates a recurring data-reporting need that fleet platforms can bill for.
- OEM pre-fitment and data monetisation: Tata Motors reports more than one million trucks and buses on Fleet Edge and about 12 petabytes of operating data as of June 2026, and the Court asked the Union government to engage manufacturers on pre-fitted tracking. Factory units remove the hardware barrier to a software subscription, so OEM-embedded platforms grow at 33.51% a year in the Marqstats forecast.
- Diesel and uptime economics: fuel and driver time are the largest cost lines for a truck operator, and CAN-bus analytics that detect fuel drain, idling and harsh driving pay for themselves within a single route cycle for long-haul fleets. BlackBuck Limited reported first-time GPS renewal rates above 70% and second and third renewals above 80% in its Q1 FY27 earnings call, which shows operators keep paying once they see the data.
- Digital public infrastructure: the Unified Logistics Interface Platform passed 100 crore API transactions in March 2025 with 129 APIs across 43 systems from 11 ministries and more than 1,300 registered companies. Fleet platforms that pull VAHAN, SARATHI and FASTag data through it can automate document checks and toll reconciliation, which raises the value of a subscription without new hardware.
Key Restraints
Three frictions slow the conversion of devices into paying subscriptions.
- Uneven state enforcement: monitoring backends are a state responsibility funded under the Nirbhaya framework, whose vehicle tracking scheme was estimated at about INR 463.90 crore with INR 332.24 crore of central assistance when it was announced in January 2020. Only 19 States and Union Territories had commissioned centres by February 2026, so the pace of new public-vehicle subscriptions will vary by state.
- Price pressure at the base tier: compliance plans in the INR 150 to INR 250 a month range compete against hundreds of small AIS-140 device vendors who sell annual renewals cheaply. That caps price growth in the largest tier and is why Marqstats holds blended revenue per vehicle growth to 4.56% a year.
- Owner-operator fragmentation: BlackBuck Limited cited 963,345 truck operators transacting on its platform in Fiscal 2024, equal to 27.52% of truck operators in India. Most own one to five trucks, pay monthly and churn when cash is tight, which raises acquisition costs for platforms selling below the enterprise tier.
Key Trends
The product mix is moving up the stack, and the buyers are changing with it.
- Video telematics moves from pilots to fleet-wide rollouts: Netradyne launched an AI drowsiness detection system for Indian commercial vehicles in September 2025 and BillionE Mobility deployed its Driver-i platform across its electric fleet in November 2025. Video and driver-monitoring software carries the highest per-vehicle price, so each rollout lifts blended revenue per vehicle.
- Fleet software is merging with freight software: Fleetx.ai acquired the transportation management system provider Pando.ai in August 2026 and said it targets INR 300 to 400 crore of profitable revenue by a proposed listing. Shippers want vehicle data and freight workflows in one contract, which favours platforms that can sell both.
- Electric fleets need different software: battery state of charge, depot charging windows and range planning replace fuel-theft and engine modules for electric small commercial vehicles and buses. Vendors that support charger protocols and battery data pick up the fastest-growing part of the light commercial segment.
Strategic Implications
- For independent platforms: the VAHAN-linked location feed is becoming a commodity input, so the defensible product is the analytics on top. Platforms should bundle certified compliance reporting into operational plans at little extra charge and sell fuel, maintenance and safety outcomes, since compliance-only revenue grows at 13.66% against 26.31% for operational analytics.
- For commercial vehicle manufacturers: factory units on more than one million Tata Motors vehicles show the installed base exists. The task is renewals after the bundled period. Open APIs that let a mixed-brand fleet pull OEM data into its own dashboard keep the OEM in the contract instead of losing it to an aggregator at year three.
- For investors and suppliers: listed exposure is concentrated in BlackBuck Limited, which reported FY26 net profit of INR 160.3 crore on revenue of INR 652.0 crore, and C.E. Info Systems Limited. Most of the market sits in private firms whose subscriber claims are company-reported, so diligence should rest on renewal rates and revenue per vehicle rather than on device counts.
Market Segmentation
Medium and heavy commercial vehicles are the largest class at USD 57.20 million, 52.0% of 2025 value, rising to USD 150.40 million in 2030 at a 21.33% CAGR. Long-haul trucks burn the most diesel and run the longest unsupervised trips, so fuel-drain alerts, CAN-bus engine data and driver scoring earn their fee fastest here.
The share slips to 47.0% by 2030. That is not weakness. Heavy trucks were digitised first, through OEM units from Tata Motors, VE Commercial Vehicles and Ashok Leyland and through aggregator platforms such as BlackBuck, so the remaining headroom is smaller than in light vehicles.
Light and small commercial vehicles account for USD 36.30 million, 33.0% of 2025 value, and are the fastest-growing class at a 26.67% CAGR to USD 118.40 million by 2030, when they hold 37.0%. E-commerce, quick-commerce and FMCG distribution fleets buy software per route and per delivery slot, and they adopt electric vans and three-tonne trucks that need battery and charging modules.
Price per vehicle is lower than for heavy trucks, but fleet sizes are larger and contracts are signed centrally by shippers and third-party logistics firms. That shortens the sales cycle compared with selling to single-truck owners.
Buses, taxis and other public service vehicles account for USD 16.50 million, 15.0% of 2025 value, growing at 25.42% to USD 51.20 million by 2030, when they hold 16.0%. This is the class directly covered by the May 2026 Supreme Court order, which ties fitness certificates and permits to a verified, VAHAN-linked tracking device and panic button.
State transport undertakings and private bus operators that were fitting devices only to pass inspection now need a live data stream. Marqstats expects most of them to buy that stream as part of a fleet software plan that also covers passenger safety video, schedule adherence and fuel.
Compliance and basic tracking is the largest tier at USD 50.60 million, 46.0% of 2025 value, but the slowest growing at 13.66% to USD 96.00 million by 2030, when its share falls to 30.0%. It covers AIS-140 location reporting, panic-button routing, geofencing and simple trip history, typically priced at INR 150 to INR 250 per vehicle per month.
The tier gains volume from public vehicle enforcement but loses price as it is folded into higher plans. It is the entry ticket, not the profit pool.
Operational and CAN analytics accounts for USD 41.80 million, 38.0% of 2025 value, and becomes the largest tier by 2030 at USD 134.40 million and 42.0%, a 26.31% CAGR. It covers CAN-bus fuel and engine telemetry, predictive maintenance, dispatch and route planning, toll reconciliation and API feeds into transport management systems, generally priced at INR 300 to INR 500 per vehicle per month.
This tier is where operators see a cash return, which is why BlackBuck Limited reports premium fuel-sensor products renewing at close to 80% on first renewal.
Video safety and driver monitoring accounts for USD 17.60 million, 16.0% of 2025 value, and is the fastest-growing tier at 38.47% to USD 89.60 million by 2030, when it holds 28.0%. It covers AI dashcam event analytics, drowsiness and distraction detection, risk scoring and coaching workflows, priced at INR 600 to INR 1,200 per vehicle per month.
Only the software subscription is counted here. Camera and driver-monitoring hardware is sized in the Marqstats India Commercial Vehicle ADAS Driver Monitoring Systems Market report and is not added.
Independent platforms, including aggregators, specialist software firms and device-plus-software vendors, hold USD 83.60 million, 76.0% of 2025 value, growing at 20.00% to USD 208.00 million in 2030, when their share is 65.0%. Their advantage is the mixed fleet: a transporter running Tata, Ashok Leyland and BharatBenz trucks wants one dashboard.
OEM-embedded platforms such as Fleet Edge, My Eicher and iAlert hold USD 26.40 million, 24.0% of 2025 value, growing at 33.51% to USD 112.00 million and 35.0% by 2030. Growth comes from paid renewals as factory-fitted units leave their bundled period and from the pre-fitment push in the May 2026 order.
By Geography
West India
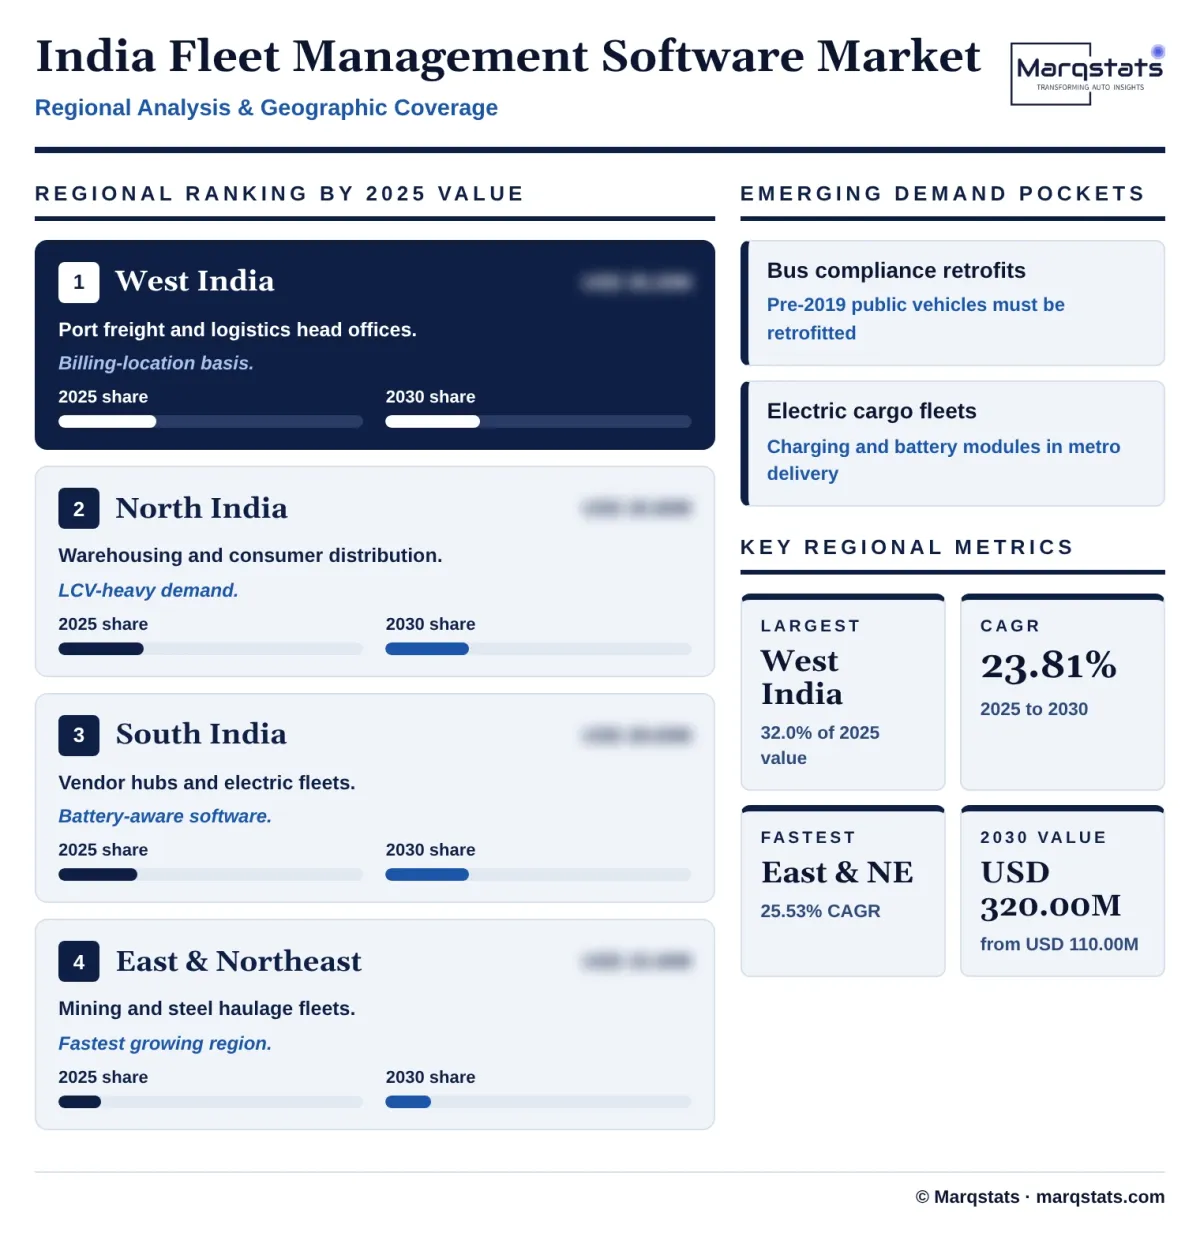
West India, led by Maharashtra and Gujarat, is the largest region at USD 35.20 million, 32.0% of 2025 value, reaching USD 99.20 million and 31.0% in 2030 at a 23.03% CAGR. Container traffic through Jawaharlal Nehru Port Authority and Mundra, chemical and automotive freight, and the head offices of many logistics firms concentrate software billing here. Shares are allocated by the billing location of the fleet operator, which differs from where vehicles are registered.
North India
North India, covering Delhi NCR, Haryana, Punjab, Uttar Pradesh and Rajasthan, accounts for USD 30.80 million, 28.0% of 2025 value, and USD 86.40 million, 27.0% of 2030 value, at a 22.91% CAGR. Warehousing clusters around Gurugram and Manesar and large consumer distribution networks drive light commercial vehicle subscriptions. The 28 September 2026 Supreme Court order seeking affidavits after a sleeper-bus fire near Jewar keeps bus compliance in Uttar Pradesh under scrutiny.
South India
South India, covering Tamil Nadu, Karnataka, Telangana, Andhra Pradesh and Kerala, accounts for USD 28.60 million, 26.0% of 2025 value, and grows at 24.75% to USD 86.40 million, 27.0% of 2030 value. Bengaluru and Chennai host many fleet software vendors and logistics technology buyers, and the region has dense electric bus and electric cargo deployments that need battery-aware software.
East and Northeast India
East and Northeast India accounts for USD 15.40 million, 14.0% of 2025 value, and is the fastest-growing region at 25.53% to USD 48.00 million, 15.0% of 2030 value. Mining, steel and coal haulage fleets in Odisha and Jharkhand have high fuel spend and theft exposure, and the region starts from a low adoption base. Registration-heavy states with low fees do not translate into billing share, which is why regions are allocated by operator location.
How Competition Is Evolving
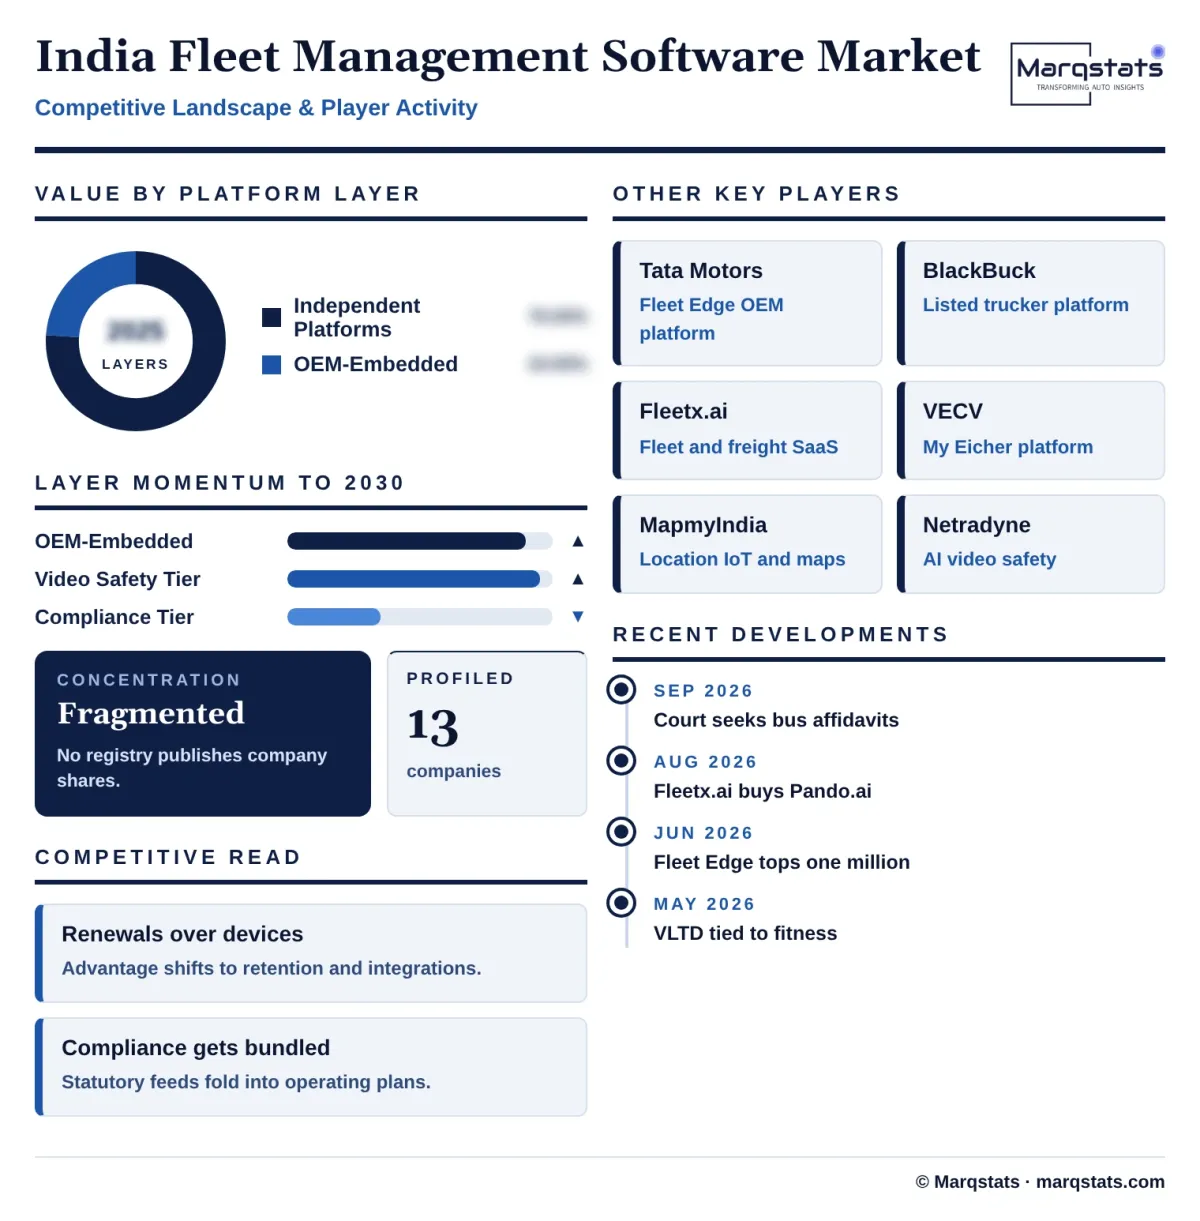
The market is fragmented across three layers, and no registry publishes company market shares, so Marqstats describes competition by layer and by dated action. The first layer is commercial vehicle manufacturers running their own platforms: Tata Motors with Fleet Edge on more than one million trucks and buses as of June 2026, as reported by the company and not independently verified, VE Commercial Vehicles with My Eicher, Ashok Leyland with iAlert, Daimler India Commercial Vehicles with Truckonnect and Mahindra with iMAXX. They hold 24.0% of 2025 value by Marqstats estimate and grow fastest.
The second layer is independent platforms. BlackBuck Limited is the only listed pure play: it reported 356,050 average monthly active telematics devices in Fiscal 2024 in its offer documents, FY26 revenue of INR 652.0 crore with net profit of INR 160.3 crore, and record quarterly device sales in Q1 FY27. Fleetx.ai reported annual recurring revenue above INR 100 crore when it raised INR 113 crore in May 2025 and bought Pando.ai in August 2026. Intangles, LocoNav, WheelsEye and others publish vehicle counts that are company claims, not independently verified, and Marqstats does not use them in sizing. C.E. Info Systems Limited (MapmyIndia) sells location IoT and fleet products inside a business that reported Q1 FY27 revenue of INR 139.7 crore.
The third layer is connectivity and specialist safety vendors: Bharti Airtel Limited and Reliance Jio Infocomm Limited supply managed IoT SIMs, while Netradyne and drivebuddyAI sell video safety analytics. Marqstats reads the market as Fragmented. Competitive advantage is shifting from device price to renewal rates, data integrations and the ability to deliver verified compliance feeds alongside operating analytics.
Companies Covered
Companies covered in the report include:
Recent Market Activity
Table of Contents
Coverage & Segmentation
The market covers recurring software revenue from commercial fleet operators in India: platform subscriptions, analytics modules, video safety and driver-monitoring software, and API or integration fees. It covers medium and heavy commercial vehicles, light and small commercial vehicles, and buses and other public service vehicles. Values are in US dollars at INR 87.00 per US dollar, base year 2025, history 2021 to 2025 and forecast 2026 to 2030.
Excluded are tracking devices, telematics control units, sensors, dashcams and their installation; cellular connectivity sold separately; passenger car connected services; general enterprise resource planning and freight-marketplace commissions; and FASTag toll value.
Sibling boundaries, do not add: the software layer here is a subset of the Marqstats India CV Telematics Fleet Safety market (USD 0.92 billion in 2025, USD 2.88 billion in 2030) and of the India Telematics Fleet Safety market (USD 1.40 billion in 2025). It overlaps the commercial vehicle slice of the India Connected Car Market (USD 161.50 million in 2025, which also counts hardware and connectivity) and the software portion of the India Commercial Vehicle ADAS Driver Monitoring Systems Market (USD 0.40 billion in 2025). None of these should be summed with the figures here.