Market Snapshot
Middle bar: base-year value × (1 + CAGR), rounded to two decimals. This is a calculated illustration, not a separately researched annual estimate.
The global livestock trailer market size is estimated at USD 1,652.45 million in 2025 and is projected to reach USD 2,124.59 million by 2030, growing at a CAGR of 5.15% over 2026 – 2030. Annual sales rise from about 77,750 new trailers to 88,400, a 2.60% annual rate, while the average selling price climbs from about USD 21,253 to USD 24,034 per trailer as the mix shifts toward larger aluminium and stainless steel units.
Marqstats defines the market as the value, at dealer selling prices before local sales taxes, of new towed trailers built to carry farm livestock: cattle, pigs, sheep and goats. It covers semi-trailers, multi-deck drawbar trailers and road-train crates, gooseneck stock trailers, and light bumper-pull and drawbar trailers below 3.5 tonnes, including combination stock trailers sold for farm use. Dedicated horse trailers and horseboxes, living-quarters conversions, rigid truck-mounted livestock bodies, used trailers, rental, and aftermarket parts and service are excluded.
Semi-trailers and road-train crates account for an estimated 49.47% of 2025 value, aluminium trailers for 46.00% and cattle trailers for 60.00%. North America accounts for 50.59% of 2025 value and Europe for 23.38%. The study segments the market by trailer type, construction material, livestock type and region.
Key Takeaways
Market Overview & Analysis
Report Summary
Marqstats sizes the livestock trailer market as the value of new towed trailers built to carry cattle, pigs, sheep and goats, at dealer selling prices before local sales taxes. About 77,750 new livestock trailers were sold worldwide in 2025, worth an estimated USD 1,652.45 million at an average selling price of about USD 21,253. The market was rebuilt bottom-up from units and prices by region and trailer type, using cattle and pig inventories, slaughter and trade flows, manufacturer disclosures, dealer price lists and trailer registration patterns.
Three types of trailer serve very different buyers. Semi-trailers, multi-deck drawbar trailers and road-train crates are bought by commercial livestock hauliers and large integrated producers that move animals from farms to feedlots, markets, ports and packing plants. Gooseneck stock trailers, a mainly North American product, are bought by ranchers and farmers who haul their own cattle behind pickup trucks. Light bumper-pull and drawbar trailers below 3.5 tonnes are bought by small farms in Europe, North America, Australia and New Zealand to move a few cattle, sheep or pigs at a time.
Prices vary by a factor of more than twenty. A light single-axle sheep or calf trailer sells for about USD 4,000 to 11,000. A gooseneck aluminium stock trailer sells for about USD 20,000 to 40,000 depending on length and options. A North American aluminium cattle pot sells for about USD 90,000 to 110,000, a European three-deck semi-trailer with lifting decks, forced ventilation, watering and temperature monitoring for about USD 110,000 to 140,000, and an Australian stainless steel road-train crate for about USD 150,000 to 180,000. Marqstats uses an average of about USD 59,018 for semi-trailer class units, USD 25,500 for goosenecks and USD 7,608 for light trailers in 2025.
Materials differ by region. North American trailers are mainly aluminium, which saves weight and resists corrosion, from builders such as Featherlite, Eby, Wilson and Merritt. European light trailers are mainly galvanised steel, led by Ifor Williams in the United Kingdom, while European semi-trailers mix aluminium bodies with steel chassis. Australian crates are increasingly built from stainless steel to withstand urine, manure and frequent washing. Latin American trailers are mainly steel with wooden or aluminium floors.
The market grew from about USD 1,538.00 million in 2021 to USD 1,640.20 million in 2022 and USD 1,700.60 million in 2023, helped by drought-driven cattle sales in the United States and high farm incomes. It eased to USD 1,671.30 million in 2024 and USD 1,652.45 million in 2025 as the US cattle herd shrank, interest rates stayed high and European demand for heavy trailers was flat. Marqstats expects USD 1,705.10 million in 2026.
Regulation shapes trailer design in each region. In the European Union, Regulation (EC) No 1/2005 sets journey times, space allowances and vehicle requirements for long journeys, including ventilation, watering, temperature monitoring and navigation systems. The European Commission proposed a replacement regulation, COM(2023)770, in December 2023, with shorter journey times, more space per animal and temperature limits. In the United States, livestock haulers have special hours-of-service exemptions and are exempt from the electronic logging device rule until further notice. Australia sets national standards for the land transport of livestock, and the United Kingdom banned live exports for slaughter and fattening through the Animal Welfare (Livestock Exports) Act 2024.
The market sits within the wider trailer industry. US trailer production fell to about 196,000 units across all types in 2025, down about 16.6%, and West European heavy trailer demand eased about 0.5%. Livestock semi-trailers are a small specialist part of that total, and gooseneck and light livestock trailers are sold mainly through farm dealers rather than truck dealers, so their demand follows farm incomes and the cattle cycle more closely than freight volumes.
Global Livestock Trailer Market Size and Forecast
The global livestock trailer market grows from USD 1,652.45 million in 2025 to USD 2,124.59 million in 2030, a CAGR of 5.15%. Marqstats expects USD 1,705.10 million in 2026, USD 1,792.40 million in 2027, USD 1,893.70 million in 2028 and USD 2,004.30 million in 2029. Growth is slow in 2026, at about 3.19%, because the US herd is still at a multi-decade low, and accelerates to about 6.00% in 2030 as herd rebuilding and fleet replacement add demand.
Units grow more slowly than value. Annual sales rise from about 77,750 trailers to 88,400, a 2.60% annual rate. Semi-trailer class units rise from about 13,850 to 15,900, goosenecks from 19,500 to 20,900 and light trailers from 44,400 to 51,600. The average selling price rises from about USD 21,253 to USD 24,034, a 2.49% annual rate, because buyers choose longer trailers, more aluminium and stainless steel, and more ventilation, watering and monitoring equipment.
Prices for each type also rise. Marqstats estimates the average semi-trailer class price rises from about USD 59,018 in 2025 to USD 68,150 in 2030, the average gooseneck from USD 25,500 to USD 29,507 and the average light trailer from USD 7,608 to USD 8,223. Aluminium extrusion and sheet prices, US tariffs on imported aluminium and steel, and labour costs at builders all push list prices up.
Replacement drives most sales. Livestock trailers last 15 to 25 years on farms and 8 to 12 years in commercial fleets, and the fleets of trailers bought in the strong farm-income years of 2013 to 2015 and 2021 to 2023 come up for replacement during the forecast. Marqstats tracks four indicators to monitor the forecast: beef replacement heifer numbers in the United States, cattle and pig slaughter and live export volumes, farm income and interest rates, and progress of the EU animal transport proposal.
The regional mix changes slowly. North America remains the largest region but its share falls from 50.59% to 49.27%, and Europe from 23.38% to 22.56%. Latin America rises from 11.50% to 12.66% and Asia-Pacific from 12.41% to 13.41%. The Middle East and Africa stays at about 2.10% of value. By material, aluminium rises from 46.00% to 49.00% and stainless steel from 10.00% to 12.00%, while steel and hybrid trailers fall from 44.00% to 39.00%. By livestock type, pig trailers rise from 22.00% to 24.00% and cattle trailers fall from 60.00% to 58.00%.
The EU proposal is the main change outside the forecast base. If new rules on space, ceiling heights, ventilation and watering were adopted with a short transition, European hauliers would need to replace or refit part of a fleet of heavy livestock trailers, adding demand above the Marqstats forecast. Because the European Parliament had not voted in committee by mid-2026 and the Council was still working on its position, Marqstats assumes no new EU vehicle rules apply before 2030 and treats the proposal as a reason for buyers to choose higher specifications.
Market Dynamics
Key Drivers
Five forces support demand for new livestock trailers worldwide.
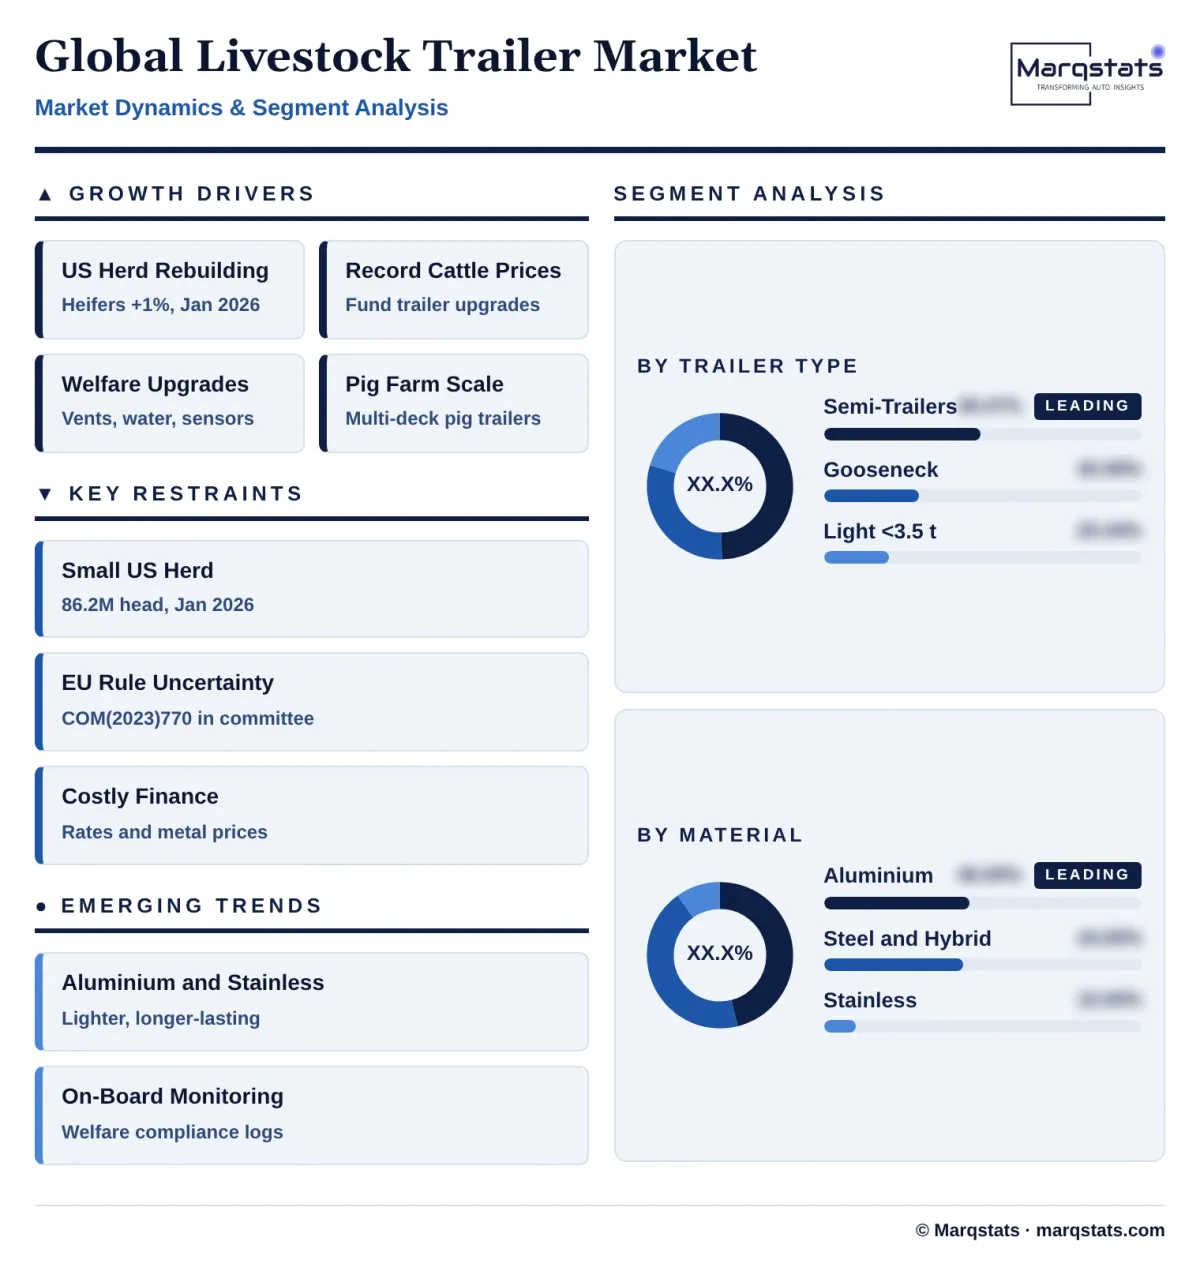
- US herd rebuilding. Beef replacement heifers rose 1% to 4.71 million on 1 January 2026, the first rise since 2021, pointing to herd expansion from 2027 that will need more gooseneck trailers on ranches and more cattle pots in commercial fleets.
- Record cattle prices. High cattle and calf prices in 2025 and 2026 lifted ranch incomes in North America, Brazil, Argentina and Australia, funding replacement of old steel trailers with aluminium and stainless steel models.
- Welfare rules raise specifications. Buyers in Europe, the United Kingdom and Australia add forced ventilation, watering systems, temperature monitoring and roof insulation to meet animal welfare rules and retailer standards, raising the value of each trailer.
- Longer journeys to packing plants. Consolidation of slaughterhouses in Brazil, Argentina, Australia and Europe lengthens the average distance animals travel, increasing demand for larger multi-deck trailers.
- Pig farm consolidation. Large integrated pig producers in China, Brazil and Europe replace small trucks with dedicated multi-deck pig trailers built for biosecurity, cleaning and disinfection.
Key Restraints
Four constraints hold back livestock trailer sales.
- Small US herd. The US cattle herd of 86.2 million head in January 2026 is near a 75-year low, and the 2025 calf crop fell 2% to 32.9 million, limiting how many animals need hauling in 2026 and 2027.
- Regulatory uncertainty in Europe. The EU proposal COM(2023)770 could change journey times, space allowances and vehicle design, but with more than 3,000 amendments tabled and no Parliament committee vote by mid-2026, some hauliers are delaying purchases of new heavy trailers.
- Live export bans and limits. The United Kingdom banned live exports of animals for slaughter and fattening in 2024, and Australia plans to end live sheep exports by sea in May 2028, shifting some transport demand from long-haul road and port trips to shorter trips to domestic abattoirs.
- Costly finance and materials. High interest rates in 2024 and 2025 and higher aluminium and steel prices raised the cost of buying a new trailer, encouraging farmers to repair or buy used trailers.
Key Trends
Four shifts are changing how livestock trailers are designed, built and sold.
- Aluminium and stainless steel replace steel. Buyers choose lighter and more corrosion-resistant bodies to carry more animals within weight limits and to extend trailer life.
- Monitoring on board. Temperature, humidity and camera systems with remote logging help hauliers prove animal welfare compliance and are becoming standard on new European semi-trailers.
- Hydraulic and lifting decks. Multi-deck trailers with hydraulic lifting decks and roofs make loading easier and safer for animals and drivers and allow one trailer to carry cattle, pigs or sheep.
- Builders expand capacity and reach. Ifor Williams added a weekend shift with up to 50 jobs in March 2026 and appointed its first South American distributor, and Merritt bought Magnum Trailer and Equipment in Canada in May 2025.
Strategic Implications
- For trailer builders, the next five years are a replacement and upgrade market. Builders that offer aluminium and stainless steel bodies, ventilation and watering packages and dealer finance will capture the value gain even where unit sales grow slowly.
- For North American builders, production planning should follow the cattle cycle. The rise in replacement heifers in January 2026 points to stronger gooseneck and cattle pot demand from 2027, so builders that hold dealer inventory and labour through 2026 will be ready for the upturn.
- For European builders, the EU proposal is a design risk and an opportunity. Trailers designed now with higher ceilings, forced ventilation, watering and temperature logging will meet likely new rules and can be sold at a premium before any rules apply.
- For hauliers and producers, specification decides resale value. Trailers that already meet stricter welfare standards keep their value better as rules tighten in Europe, the United Kingdom and Australia.
- For component suppliers, axles, suspension, flooring and monitoring systems are the growth areas. Air suspension, lightweight composite and aluminium floors and connected monitoring systems are added to more trailers each year.
- For investors, the market offers steady growth tied to food production rather than freight cycles. Demand follows cattle and pig numbers, farm incomes and welfare rules, which move slowly, while the shift to aluminium, stainless steel and monitoring raises value per trailer each year.
Market Segmentation
Semi-trailers, multi-deck drawbar trailers and road-train crates account for 49.47% of 2025 value, USD 817.40 million and about 13,850 trailers, rising to USD 1,083.58 million and 51.00% of the market by 2030, a 5.80% CAGR. The segment includes North American aluminium cattle pots, European two- and three-deck trailers with lifting decks, Australian stainless road-train crates, Brazilian boiadeira trailers and Chinese pig trailers.
Gooseneck trailers towed by pickup trucks account for 30.09% of 2025 value, USD 497.25 million and about 19,500 trailers, almost all in North America, and grow at 4.40% a year to USD 616.70 million and 29.03% of 2030 value as US ranchers rebuild herds.
Light trailers below 3.5 tonnes account for 20.44% of 2025 value, USD 337.80 million and about 44,400 trailers, the largest number of units, and grow at 4.67% a year to USD 424.31 million and 19.97% of 2030 value. Ifor Williams leads in the United Kingdom and Ireland, and many small builders serve Europe, Australia, New Zealand and North America.
Aluminium trailers account for 46.00% of 2025 value, USD 760.13 million, led by North American goosenecks and cattle pots, and grow at 6.49% a year to USD 1,041.05 million and 49.00% of 2030 value.
Galvanised steel trailers and trailers with steel chassis and aluminium or composite bodies account for 44.00% of 2025 value, USD 727.08 million, and grow at 2.65% a year to USD 828.59 million, while their share falls to 39.00%.
Stainless steel trailers account for 10.00% of 2025 value, USD 165.24 million, led by Australian road-train crates, and grow fastest, at 9.06% a year, to USD 254.95 million and 12.00% of 2030 value.
Cattle trailers account for 60.00% of 2025 value, USD 991.47 million, and grow at 4.44% a year to USD 1,232.26 million, while their share falls to 58.00%.
Pig trailers account for 22.00% of 2025 value, USD 363.54 million, and grow at 7.00% a year to USD 509.90 million and 24.00% of 2030 value.
Trailers for sheep and goats and multi-species trailers account for 18.00% of 2025 value, USD 297.44 million, and grow at 5.16% a year to USD 382.43 million, holding an 18.00% share.
By Geography
North America
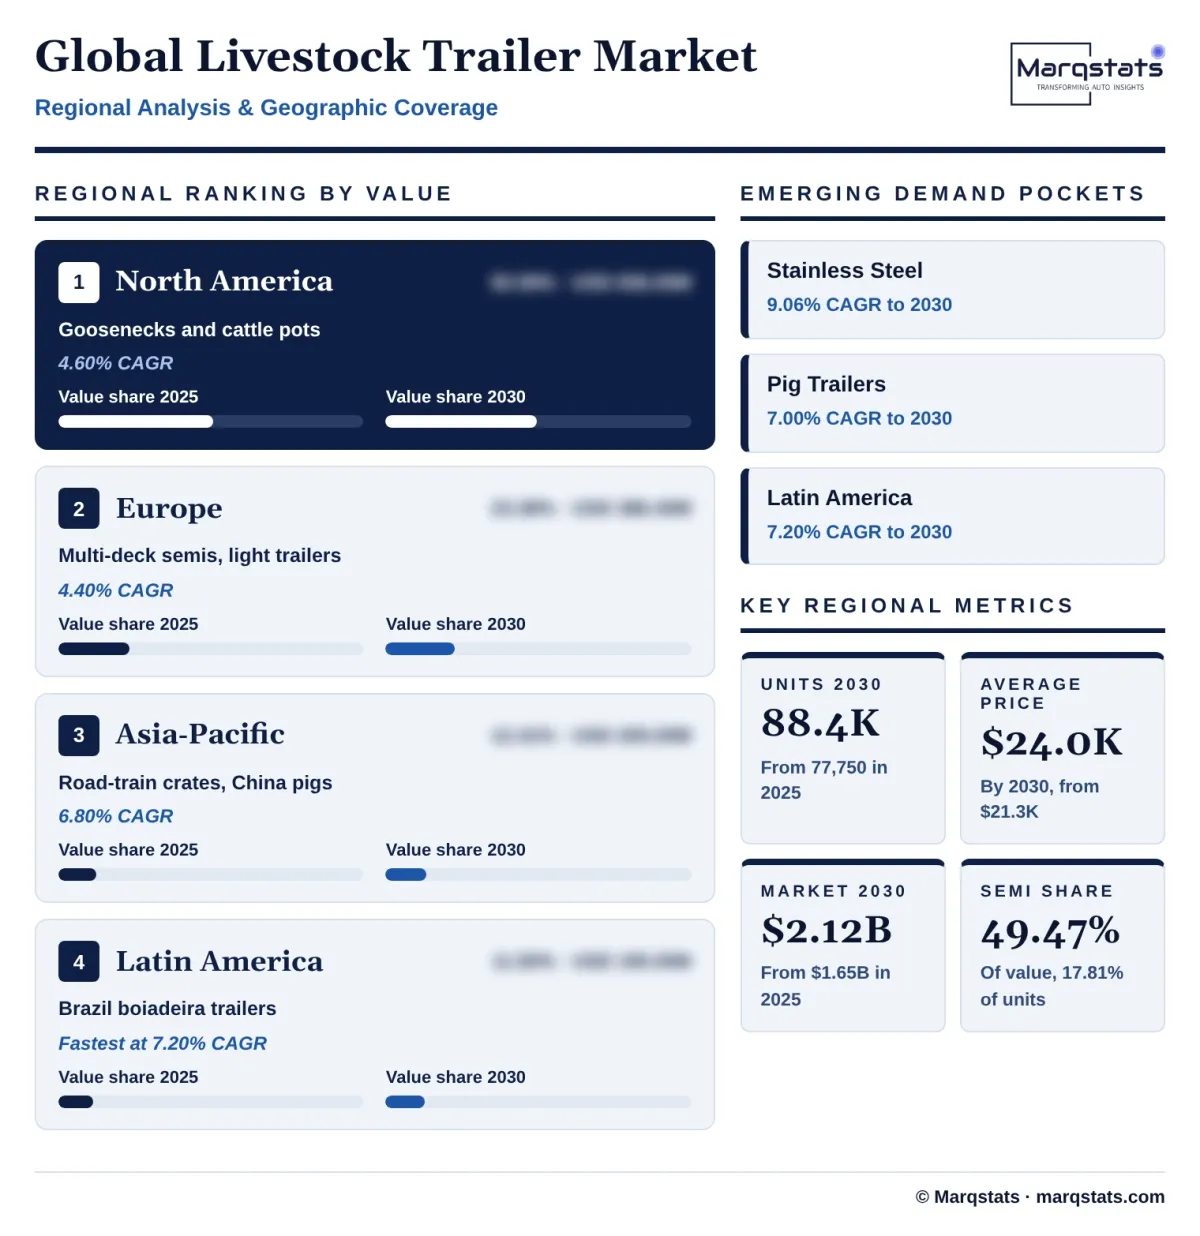
North America is the largest market, with 50.59% of 2025 value, USD 836.05 million and about 32,300 trailers, rising to USD 1,046.86 million by 2030, a 4.60% CAGR, while its share falls slightly to 49.27%. The United States accounts for most of the region. About 19,500 gooseneck stock trailers, 10,500 bumper-pull trailers and 2,300 cattle pots and other livestock semi-trailers are sold each year, mainly aluminium. The USDA January 2026 cattle report showed 86.2 million cattle and calves, down 0.4%, and beef cows down 1% to 27.6 million, but replacement heifers up 1%. Livestock haulers remain exempt from the US electronic logging device rule until further notice.
Europe
Europe accounts for 23.38% of 2025 value, USD 386.40 million and about 23,900 trailers, and grows at 4.40% a year to USD 479.23 million and 22.56% of 2030 value. About 1,900 heavy multi-deck semi-trailers and drawbar trailers worth about USD 120,000 each account for most of the value, while about 22,000 light trailers below 3.5 tonnes account for most units. The EU proposal COM(2023)770 on animal welfare during transport remained in committee in the European Parliament in mid-2026, and a Council progress report in June 2026 proposed stronger vehicle design rules for ventilation, roofs, lighting, watering and minimum ceiling heights.
Asia-Pacific
Asia-Pacific accounts for 12.41% of 2025 value, USD 205.00 million and about 11,050 trailers, and grows at 6.80% a year to USD 284.85 million and 13.41% of 2030 value. Australia buys about 550 stainless steel and aluminium road-train crates a year worth about USD 160,000 each and about 6,000 light trailers across Australia and New Zealand. China buys about 3,500 pig and cattle semi-trailers a year as pig farming consolidates into large integrated companies.
Latin America
Latin America accounts for 11.50% of 2025 value, USD 190.00 million and about 8,000 trailers, and grows fastest, at 7.20% a year, to USD 268.98 million and 12.66% of 2030 value. Brazil, home to one of the largest commercial cattle herds in the world, buys about 2,800 boiadeira cattle semi-trailers a year, and Argentina, Uruguay and Paraguay about 1,200 more, as export packing plants draw cattle over longer distances.
Middle East and Africa
The Middle East and Africa account for 2.12% of 2025 value, USD 35.00 million and about 2,500 trailers, and grow at 5.00% a year to USD 44.67 million and 2.10% of 2030 value. South Africa is the largest market, with commercial cattle and sheep hauling, while Gulf states import sheep and cattle and move them from ports to farms and abattoirs.
How Competition Is Evolving
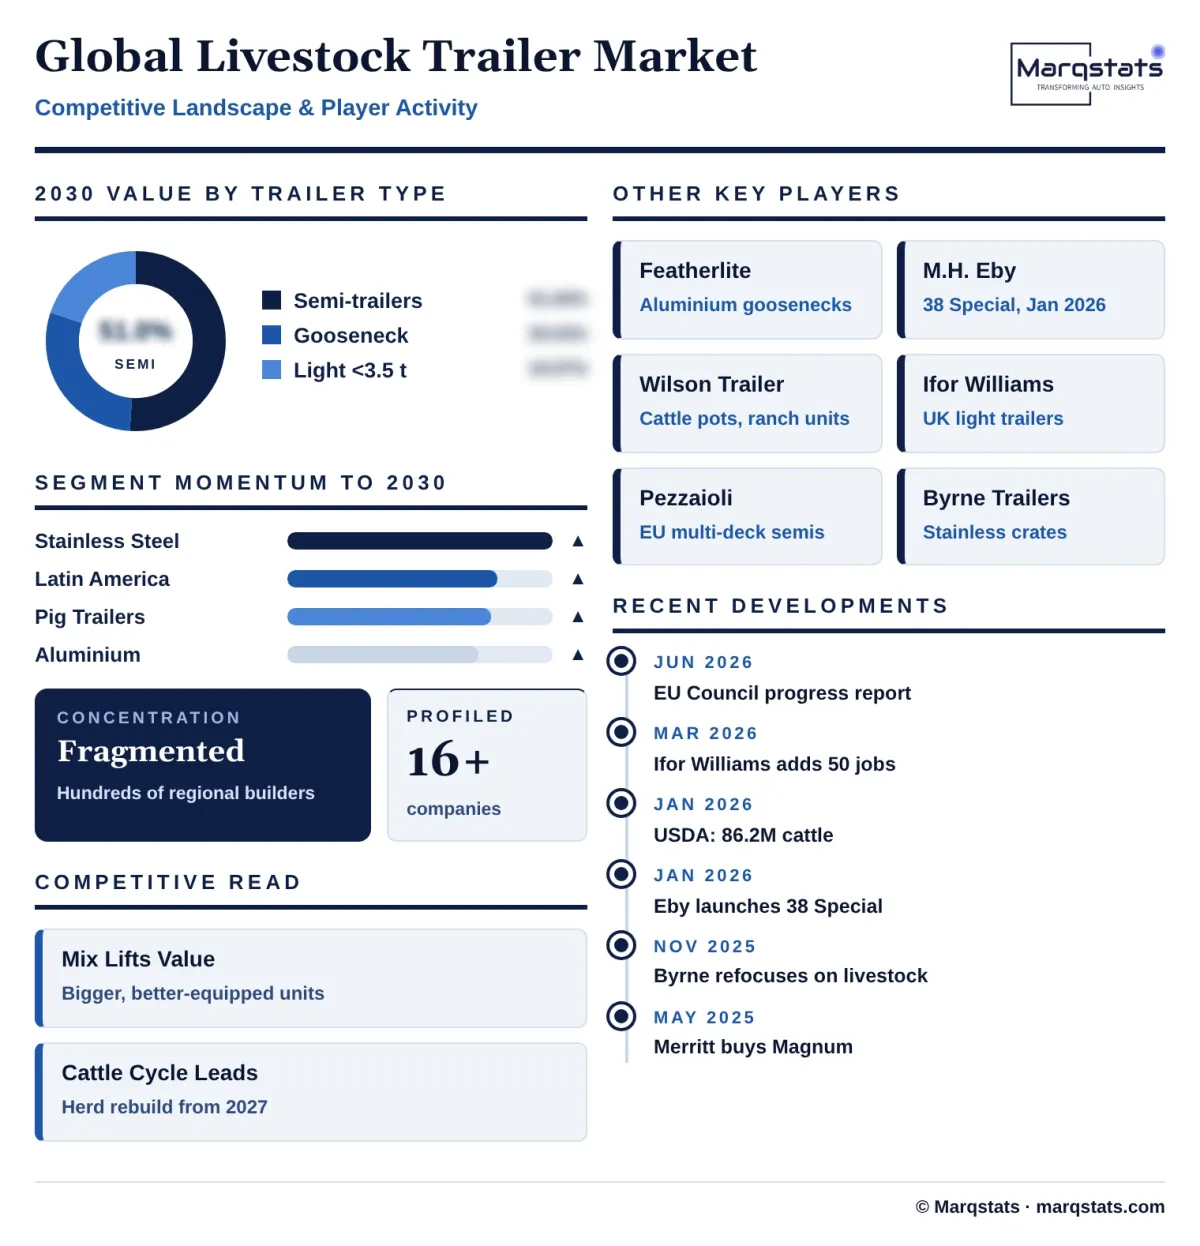
The livestock trailer market is fragmented. Hundreds of builders serve local farm and haulage markets, and no company holds more than a small share of global value. The largest companies are regional leaders: Featherlite, M.H. Eby, Wilson Trailer, Merritt Equipment, Barrett Trailers and W-W Trailer in North America; Ifor Williams Trailers in light trailers in the United Kingdom and Ireland; Carrozzeria Pezzaioli, Michieletto, Menke Janzen and Finkl in European heavy livestock trailers; and Byrne Trailers and Haulmark Trailers in Australia.
Competition differs by type. In goosenecks and light trailers, builders compete through dealer networks, finance, price and resale value, and buyers often stay loyal to a brand for decades. In semi-trailers, builders compete on payload, ventilation and loading systems, durability and after-sales service, and many trailers are built to order for each haulier.
Company data show the scale of leading builders. Carrozzeria Pezzaioli, the Italian livestock semi-trailer specialist, reported revenue of about EUR 47.26 million in 2024, about USD 53.40 million at the 2025 average rate, with about 135 employees. Ifor Williams Trailers, based in Corwen, Wales, builds galvanised steel livestock, general purpose and plant trailers sold through a dealer network across the United Kingdom, Ireland and export markets.
Capacity is being added. Ifor Williams added a weekend shift with up to 50 jobs at its Ty'n Llidiart plant in March 2026 and appointed a distributor in Buenos Aires, its first in South America. Merritt Equipment of Colorado bought Magnum Trailer and Equipment of Abbotsford, British Columbia, in May 2025, adding Canadian manufacturing and service. Byrne Trailers refocused its business on livestock trailers in November 2025.
Product launches target the farm market. M.H. Eby launched the 38 Special bumper-hitch livestock trailer in January 2026 to replace the Maverick LS, and builds aluminium trailers at plants in Blue Ball and Ephrata, Pennsylvania. Wilson Trailer sells the Ranch Hand and Foreman ranch trailers and the PSDCL cattle pot. Featherlite sells aluminium livestock goosenecks such as the 8127 and 8117 through farm dealers across North America.
Companies Covered
Companies covered in the report include:
Recent Market Activity
Table of Contents
Coverage & Segmentation
The study covers the global livestock trailer market, with 2025 as the base year, 2021 – 2025 as the historical period and 2026 – 2030 as the forecast period. Values are in US dollars at dealer selling prices before local sales taxes, and volumes are annual sales of new trailers. Euro values are converted at the 2025 annual average rate of EUR 1 = USD 1.13. The market is segmented by trailer type, construction material, livestock type and region.
Dedicated horse trailers and horseboxes, living-quarters conversions, rigid truck-mounted livestock bodies, used trailers, rental, and aftermarket parts and service are excluded. Poultry crates and modules are excluded. Segment and regional splits are Marqstats estimates built on livestock inventories, slaughter and trade data, manufacturer disclosures, dealer price lists and registration patterns.