Market Snapshot
Middle bar: base-year value × (1 + CAGR), rounded to two decimals. This is a calculated illustration, not a separately researched annual estimate.
The global EV battery cell cans and cases market size is estimated at USD 4,206.73 million in 2025 and is projected to reach USD 8,041.16 million by 2030, growing at a CAGR of 13.83% over 2026 – 2030. The EV battery capacity these enclosures house rises from 1,187 GWh to about 2,650 GWh, a 17.42% annual rate, while the enclosure value per kWh falls from about USD 3.54 to USD 3.03.
Marqstats defines the market as the value of the cell-level enclosures fitted to lithium-ion traction cells used in electric passenger cars and commercial vehicles. It covers deep-drawn aluminium prismatic shells, top cover assemblies with vents, terminals and seals, nickel-plated steel cylindrical cans and safety caps, and aluminium laminate film for pouch cells, valued at the price paid by cell makers, with in-house production valued at equivalent market prices. Pack trays, pack lids, module frames, cooling plates, busbars, active cell materials and enclosures for stationary storage, consumer and two-wheeler cells are excluded.
Prismatic shells and covers account for 72.91% of 2025 value, and top covers and safety caps for 49.20%. Asia-Pacific accounts for 79.00% of 2025 value and Europe for 10.50%. The study segments the market by cell format, component, vehicle type and region.
Key Takeaways
Market Overview & Analysis
Report Summary
Marqstats sizes the EV battery cell cans and cases market as the value of the enclosures that hold each lithium-ion traction cell. In 2025 global EV battery installations reached 1,187 GWh, up 31.70% from 901.40 GWh in 2024, and the enclosures fitted to those cells were worth an estimated USD 4,206.73 million, about USD 3.54 per kWh.
Every lithium-ion cell needs a sealed container. Prismatic cells use a deep-drawn aluminium shell closed by a top cover that carries the positive and negative terminals, an explosion-proof vent, an electrolyte filling port, insulating seals and plastic parts. Cylindrical cells use a deep-drawn nickel-plated steel can closed by a cap with a vent and current interrupt device. Pouch cells use an aluminium laminate film, a multi-layer sheet of nylon, aluminium foil and polypropylene, which is formed into cups and heat sealed.
Enclosures are a small share of cell cost but a demanding part to make. Industry estimates put structural parts at roughly 7% of the cost of a ternary cell, close to the combined share of electrolyte and separator. The parts must hold dimensional tolerances of a few hundredths of a millimetre so cells can be welded and stacked by robots, keep moisture out for the full life of the battery, and open the vent at a set pressure if a cell overheats.
The supply base is concentrated in China. Shenzhen Kedali, the largest maker, reported 2025 revenue of RMB 15.21 billion, about USD 2.12 billion at RMB 7.16 per US dollar, up 26.46%, almost all from lithium battery structural parts for EV, energy storage and consumer cells. Ningbo Zhenyu reported 2025 revenue of RMB 9.74 billion, up 36.57%, from motor cores and battery structural parts. Korean makers Sangsin EDP and Shinheung SEC supply cylindrical and prismatic parts to Korean cell makers, and BYD makes enclosures in-house through FinDreams.
The market grew from an estimated USD 1,365.28 million in 2021 to USD 2,304.66 million in 2022, USD 2,786.73 million in 2023 and USD 3,335.18 million in 2024, as global EV battery installations rose from about 297 GWh to 901 GWh. Value per kWh fell over the period as cell formats grew larger and aluminium prices eased after 2022. Marqstats expects the market to reach USD 4,884.80 million in 2026.
Cell enclosures for stationary storage are a large adjacent market. Energy storage cells use the same aluminium prismatic shells and covers, mostly in 280 Ah and 314 Ah formats, and make up a growing share of supplier revenue. Marqstats excludes them so that the market tracks electric vehicles only, which is why the market is smaller than the total lithium battery structural parts revenue reported by the leading suppliers.
Each format has its own production chain. Prismatic shells are deep drawn from 3003 or similar aluminium alloy coil in several stages, trimmed, cleaned and inspected, while covers are assembled from stamped aluminium plates, copper and aluminium terminals, rivets, plastic insulators, rubber or ceramic seals and a laser-welded vent sheet. Cylindrical cans are drawn and ironed from nickel-plated steel strip in high-speed presses, and caps combine a vent disc, a current interrupt device, a gasket and a top plate. Pouch film is made by laminating aluminium foil with nylon and polypropylene layers. Leading suppliers run hundreds of presses and laser welding lines, and yields above 98% are needed to make money.
Regulation shapes enclosure design in every major market. China's GB 38031-2025 replaces GB 38031-2020 and requires that a battery shows no fire or explosion after a single cell enters thermal runaway, applying to new type approvals from 1 July 2026 and to existing types from 1 July 2027. UN Regulation No. 100 requires warning and protection for occupants in a thermal event. The EU Battery Regulation (EU) 2023/1542 adds carbon footprint declarations, recycled content targets and a battery passport, which favour low-carbon and recycled aluminium in shells and covers.
Global EV Battery Cell Cans and Cases Market Size and Forecast
The global EV battery cell cans and cases market grows from USD 4,206.73 million in 2025 to USD 8,041.16 million in 2030, a CAGR of 13.83%. Marqstats expects USD 5,627.70 million in 2027, USD 6,395.40 million in 2028 and USD 7,199.00 million in 2029.
The forecast multiplies EV battery demand by enclosure value per kWh for each cell format. Marqstats expects global EV battery installations of about 1,420 GWh in 2026, 1,690 GWh in 2027, 1,980 GWh in 2028, 2,300 GWh in 2029 and 2,650 GWh in 2030, and enclosure value per kWh of about USD 3.44 in 2026, USD 3.33 in 2027, USD 3.23 in 2028, USD 3.13 in 2029 and USD 3.03 in 2030.
Value per kWh differs widely by format. Marqstats estimates prismatic shells and covers at about USD 3.40 per kWh in 2025, falling to USD 2.92 by 2030 as cells move from 150 to 230 Ah automotive formats towards larger blade and long-format cells. Cylindrical cans and caps cost about USD 6.20 per kWh in 2025, falling to USD 4.60 as 46-series cells replace 2170 cells. Pouch laminate film costs about USD 1.40 per kWh, falling to USD 1.20.
The mix by format is stable. Marqstats expects prismatic cells to hold about 76% to 77% of EV battery capacity, cylindrical cells to rise from about 13% to 15% as Tesla, BMW and other carmakers adopt 46-series cells, and pouch cells to fall from about 11% to 8% as Korean cell makers add prismatic and cylindrical lines.
Aluminium prices and cell prices set the floor. Aluminium coil is the largest material cost of a prismatic shell and nickel-plated steel the largest cost of a cylindrical can, so metal prices pass through to enclosure prices with a lag. Falling cell prices push buyers to ask for annual price cuts of a few percent. Marqstats tracks four indicators to monitor the forecast: global EV battery installations, average cell capacity by format, aluminium and nickel prices, and the share of 46-series cells in cylindrical output.
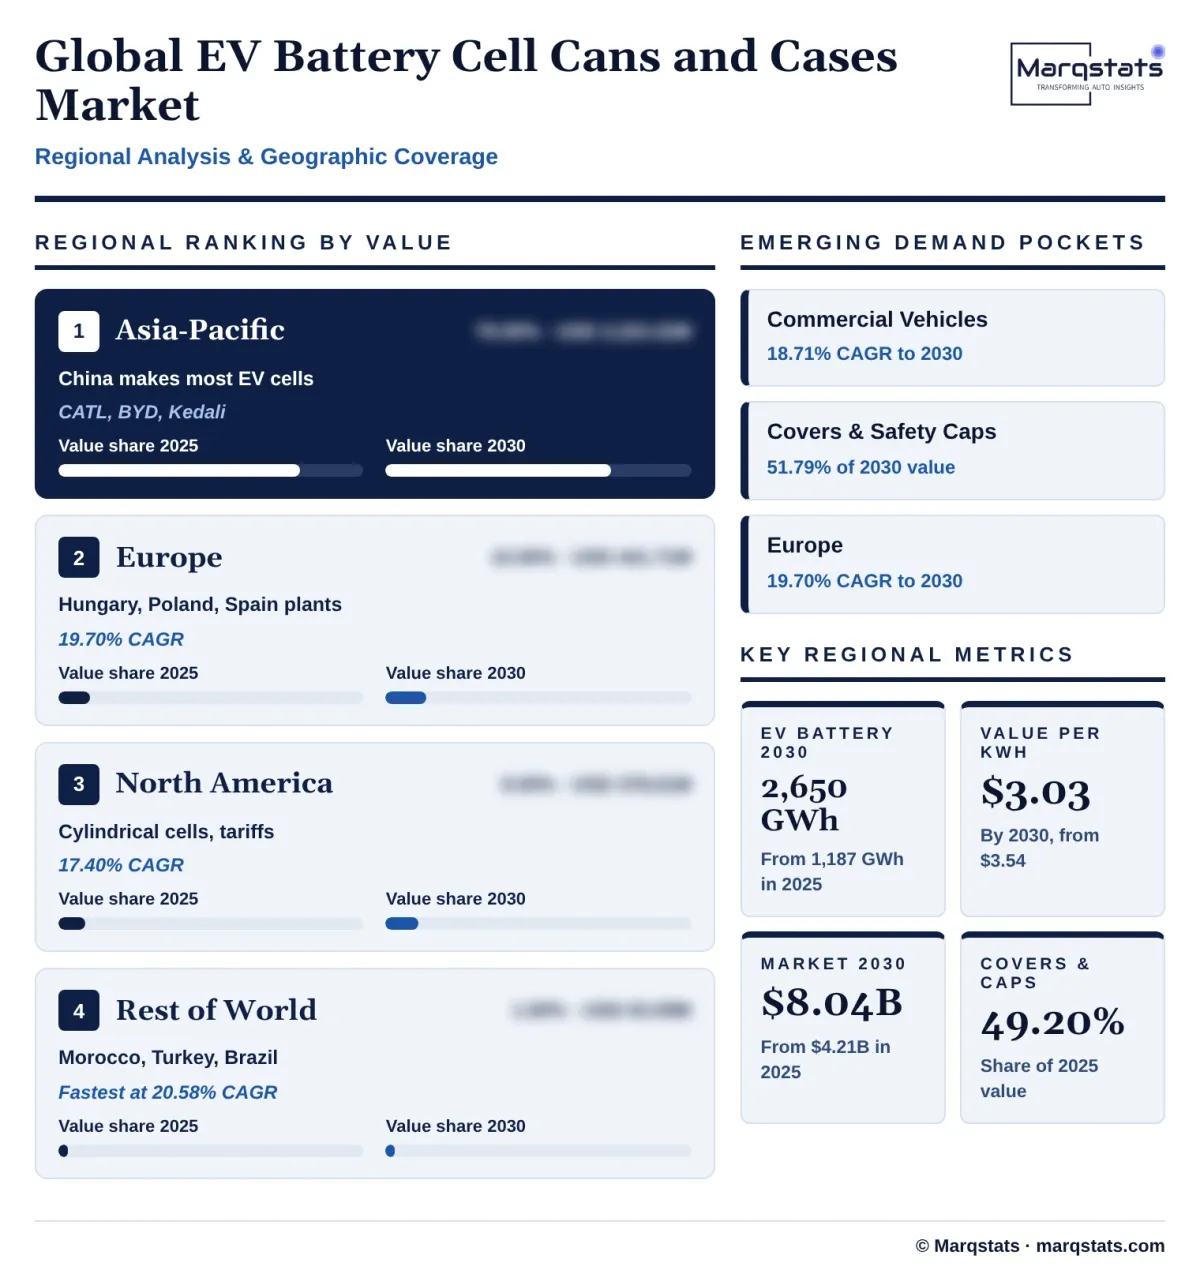
The mix by component shifts towards covers. Top covers and safety caps rise from 49.20% to 51.79% of value as vents, insulation and sensor features are added, while cans and shells fall from 46.45% to 45.05% and pouch film from 4.35% to 3.16%. Commercial vehicles rise from 15.00% to 18.50% of value. Europe rises from 10.50% to 13.50% and North America from 9.00% to 10.50% as cell production spreads beyond Asia.
Supplier revenue gives a cross-check. Kedali reported RMB 15.21 billion of 2025 revenue, about USD 2.12 billion, and Ningbo Zhenyu RMB 9.74 billion, about USD 1.36 billion, though both figures include energy storage and consumer cell parts and, for Zhenyu, motor cores. With stationary storage cells adding several hundred GWh of demand at lower value per kWh, the combined lithium battery structural parts pool is larger than the EV-only market sized here, and Kedali alone accounts for an estimated quarter to a third of it.
Market Dynamics
Key Drivers
Five forces are lifting demand for the metal cans, covers and films that hold each EV battery cell.
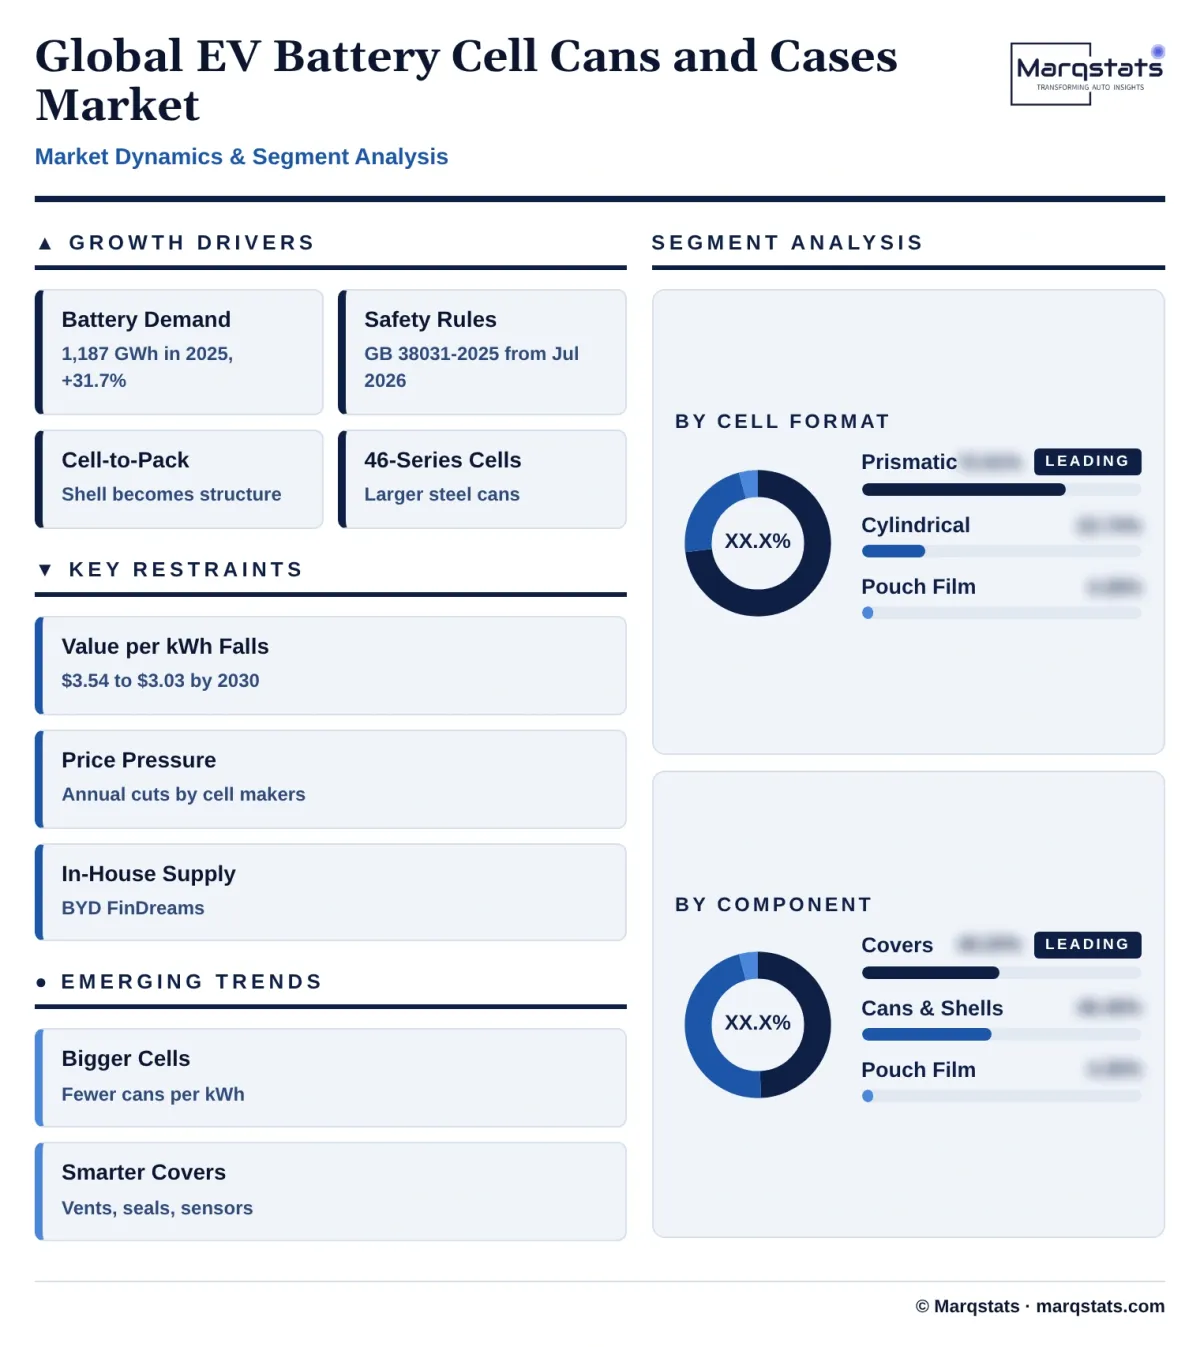
- Growing EV battery demand. Global EV battery installations rose 31.70% to 1,187 GWh in 2025, and every kWh of new capacity needs cans, covers or film. Marqstats expects installations of about 2,650 GWh by 2030.
- Stricter thermal runaway rules. China's GB 38031-2025 applies to new type approvals from 1 July 2026 and to existing types from 1 July 2027 and requires no fire or explosion after a single cell enters thermal runaway, while UN Regulation No. 100 requires protection of occupants. Cell makers respond with more precise vents, stronger seals and covers designed to direct gas away from neighbouring cells.
- Cell-to-pack designs. Packs that place cells directly in the tray, such as CATL Qilin and BYD Blade, remove module frames and use the cell shell as a structural part, which raises the strength and flatness required of prismatic shells.
- Localisation of cell plants. New cell factories in Hungary, Poland, Germany, Spain, the United States and Southeast Asia need nearby enclosure supply, because empty cans and covers are bulky to ship and cell makers want short supply chains.
- Growth in 46-series cylindrical cells. Tesla said in January 2026 that Giga Texas was producing 4680 cells with dry-processed cathodes and anodes, and BMW, Panasonic, LG Energy Solution and EVE are building 46-series cells, creating demand for larger, deeper steel cans and new caps.
- Commercial vehicle electrification. Electric buses, trucks and vans use large LFP packs, so each vehicle needs hundreds of prismatic cells and their covers, adding volume even where passenger car sales slow.
Key Restraints
Four constraints hold back value growth for cell can and case makers.
- Value per kWh falls. Larger cells need fewer enclosures per kWh, so supplier revenue grows more slowly than battery demand.
- Price pressure from cell makers. Large buyers such as CATL and BYD negotiate annual price cuts and use several suppliers, and second-tier Chinese makers operate on gross margins of about 10%, against more than 20% for the leaders.
- In-house production. BYD makes enclosures through FinDreams, and some cell makers build their own shell or cap lines, which reduces the market open to independent suppliers.
- Trade barriers. US Section 301 tariffs on Chinese lithium-ion EV batteries rose to 25% in September 2024 and on other lithium-ion batteries to 25% from 1 January 2026, and EU and US local content rules push cell makers to qualify local enclosure suppliers, raising costs for exporters.
Key Trends
Four shifts are changing how EV battery cell enclosures are designed, made and bought.
- Larger cells. Automotive prismatic cells are moving to higher capacity and longer formats, blade and long cells are spreading, and cylindrical cells are moving from 2170 to 46-series, all of which lower enclosure count per kWh.
- Smarter covers. Covers add finer vent control, integrated sensors, insulation films and features that direct gas and flame away from neighbouring cells, raising the value of the cover relative to the shell.
- Suppliers build abroad. Kedali has a plant in Hungary and new subsidiaries in the United States and Thailand, Ningbo Zhenyu has a plant in Debrecen, Hungary, and Korean suppliers have plants in Hungary near Samsung SDI and other cell makers.
- Prismatic shift by Korean cell makers. LG Energy Solution, Samsung SDI and SK On are adding prismatic and 46-series cylindrical lines, which shifts demand away from pouch film towards metal shells and cans.
- Lower-carbon aluminium. Cell makers selling into Europe ask enclosure suppliers for recycled and low-carbon aluminium coil to reduce the carbon footprint they must declare under the EU Battery Regulation.
Strategic Implications
- For enclosure suppliers, the cover is where margin is made. Investment in vent, terminal and sealing technology and in automated laser welding protects margins better than adding plain shell drawing capacity.
- For cell makers, local supply is a qualification task. Qualifying two suppliers near each new cell plant reduces freight and inventory and helps meet local content rules in Europe and North America.
- For carmakers, cell format decides enclosure cost. Moving from 2170 to 46-series cylindrical cells or to larger prismatic cells cuts enclosure cost per kWh by more than half in some cases.
- For equipment makers, high-speed presses and laser welders are in demand. Each new shell or cap line needs deep-drawing presses, cleaning, laser welding and leak testing equipment.
- For investors, value per kWh is the key assumption. Revenue growth for enclosure suppliers depends on battery demand minus the fall in content per kWh, so the pace of cell format change matters as much as EV sales.
- For policy makers, enclosure supply is part of battery localisation. Cell plants in Europe and North America rely on imported covers and cans unless local enclosure plants are built, so support for cell factories works best when it also covers their component suppliers.
Market Segmentation
Aluminium prismatic shells and top covers account for 72.91% of 2025 value, USD 3,067.21 million, on about 902 GWh of prismatic cells, and grow at 14.20% a year to USD 5,958.26 million, 74.10% of 2030 value. LFP prismatic cells from CATL, BYD, CALB, EVE and Gotion drive the segment, and Samsung SDI and other Korean cell makers add prismatic volume.
Nickel-plated steel cans and safety caps account for 22.74% of 2025 value, USD 956.72 million, on about 154 GWh of cylindrical cells, and grow at 13.83% a year to USD 1,828.50 million. Value per kWh is the highest of any format because small 2170 cells need many cans per kWh, but it falls as 46-series cells from Tesla, Panasonic, LG Energy Solution and BMW suppliers scale.
Aluminium laminate film for pouch cells accounts for 4.35% of 2025 value, USD 182.80 million, on about 131 GWh of pouch cells, and grows at 6.83% a year to USD 254.40 million and 3.16% of 2030 value as Korean cell makers shift part of their capacity to prismatic and cylindrical cells.
Top covers for prismatic cells and safety caps for cylindrical cells account for 49.20% of 2025 value, USD 2,069.66 million, and grow at 15.01% a year to USD 4,164.18 million, 51.79% of 2030 value. Covers carry terminals, vents, seals and filling ports, and Marqstats estimates they account for about 55% of prismatic enclosure value, rising to about 57% by 2030.
Deep-drawn aluminium shells and nickel-plated steel cans account for 46.45% of 2025 value, USD 1,954.27 million, and grow at 13.14% a year to USD 3,622.58 million, 45.05% of 2030 value. Shell value depends on wall thickness, alloy and flatness, which rise for cells used in cell-to-pack designs.
Aluminium laminate film accounts for 4.35% of 2025 value, USD 182.80 million, and grows at 6.83% a year to USD 254.40 million, supplied mainly by Japanese film makers and a growing number of Chinese producers.
Cell enclosures for battery electric and plug-in hybrid passenger cars account for 85.00% of 2025 value, USD 3,575.72 million, and grow at 12.88% a year to USD 6,553.55 million, 81.50% of 2030 value.
Cell enclosures for electric buses, trucks and vans account for 15.00% of 2025 value, USD 631.01 million, and grow fastest, at 18.71% a year, to USD 1,487.61 million and 18.50% of 2030 value, because heavy vehicles carry packs of several hundred kWh, mostly LFP prismatic cells.
By Geography
Asia-Pacific
Asia-Pacific is the largest market, with 79.00% of 2025 value, USD 3,323.32 million, rising to USD 5,950.46 million by 2030, a 12.36% CAGR, while its share falls to 74.00%. China makes most of the world's EV cells, led by CATL with 464.70 GWh of 2025 EV installations and BYD with 194.80 GWh, and hosts the largest enclosure makers, including Kedali, Ningbo Zhenyu, Everwin, Wuxi Jinyang and SLAC. South Korea and Japan add cylindrical and pouch demand through LG Energy Solution, Samsung SDI, SK On and Panasonic.
Europe
Europe accounts for 10.50% of 2025 value, USD 441.71 million, and grows at 19.70% a year to USD 1,085.56 million and 13.50% of the market by 2030. Cell plants in Hungary, Poland, Germany, Spain and France ramp up, CATL builds in Debrecen and Spain, and Kedali, Ningbo Zhenyu, Sangsin EDP and Shinheung SEC supply from plants in Hungary. The EU Battery Regulation (EU) 2023/1542 adds carbon footprint and recycled content rules that favour local supply.
North America
North America accounts for 9.00% of 2025 value, USD 378.61 million, and grows at 17.40% a year to USD 844.32 million and 10.50% of the market by 2030. Cylindrical cells from Tesla and Panasonic raise value per kWh in the region, and Section 301 tariffs on Chinese batteries push cell makers to build locally and qualify nearby enclosure supply.
Rest of the World
The rest of the world accounts for 1.50% of 2025 value, USD 63.09 million, and grows fastest, at 20.58% a year, to USD 160.82 million by 2030, as Morocco, Turkey and Brazil add cell and pack assembly.
How Competition Is Evolving
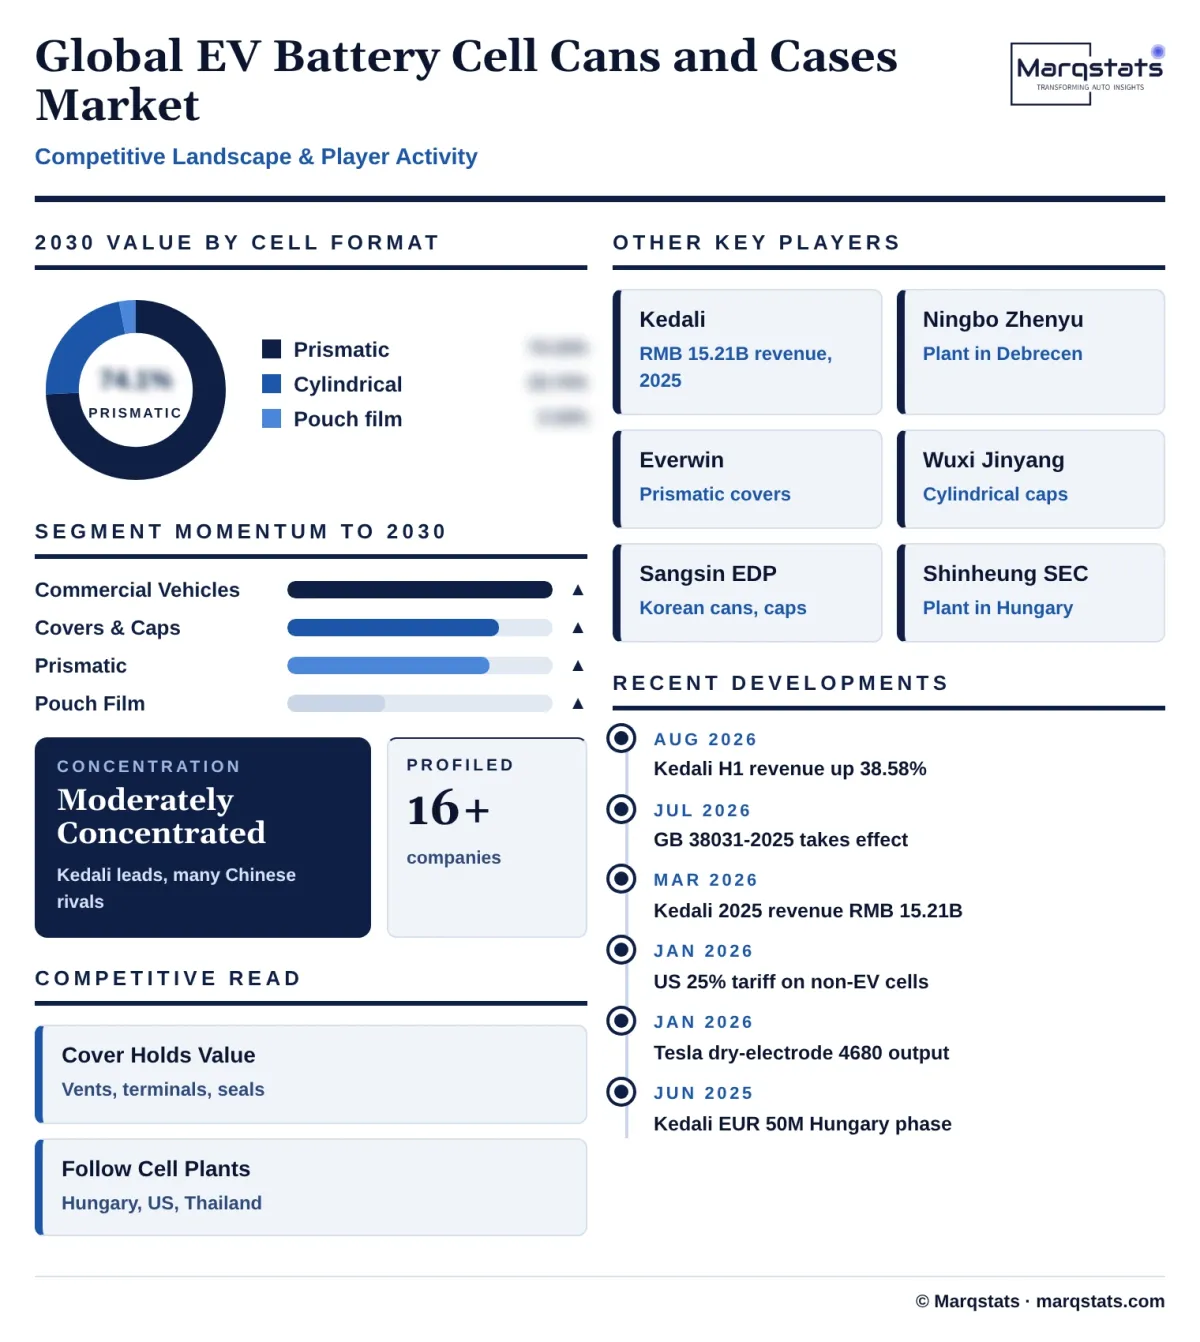
The EV battery cell cans and cases market is moderately concentrated. Shenzhen Kedali is the largest supplier, with industry estimates of about 30% of global lithium battery structural parts and more than half of the Chinese market, followed by Ningbo Zhenyu, Everwin Precision, Wuxi Jinyang, SLAC Precision and Lingyi iTech in China, Sangsin EDP and Shinheung SEC in Korea, and Toyo Kohan, Dai Nippon Printing and Resonac in steel and laminate materials.
The leaders compete on scale, precision and closeness to the customer. Kedali builds plants next to major cell factories in China and Europe and reported a 23.70% gross margin on metal structural parts in 2025, while second-tier makers earn gross margins of about 10% and net margins of 2% to 3%.
Large cell makers spread their purchases. CATL, CALB, EVE and Gotion buy from several Chinese suppliers, BYD makes most of its enclosures through FinDreams, and Korean cell makers buy from Korean and Chinese suppliers for plants in Europe and North America.
Competition will be decided by cover technology, overseas capacity and cost. Suppliers that combine reliable vent and seal design, automated welding, plants near new cell factories and the scale to absorb annual price cuts will capture the largest share of growth.
Overseas expansion is accelerating. Kedali approved up to EUR 50 million for the third phase of its Gödöllő plant in June 2025, expecting about EUR 100 million of annual revenue at full capacity and a construction period of about 24 months, and added subsidiaries in the United States, Thailand and Hong Kong in 2025. Ningbo Zhenyu invested about USD 65.90 million in a battery parts plant in Debrecen announced in July 2023.
Price and technology move together. Large buyers ask for price cuts each year, and suppliers offset them through higher automation, thinner but stronger shells, higher press speeds and better yields. Covers for large LFP cells used in cell-to-pack designs and caps for 46-series cylindrical cells are the main areas of new product development, and each new cover or cap design must be qualified with the cell maker for one to two years before volume production.
Companies Covered
Companies covered in the report include:
Recent Market Activity
Table of Contents
Coverage & Segmentation
The study covers the global EV battery cell cans and cases market, with 2025 as the base year, 2021 – 2025 as the historical period and 2026 – 2030 as the forecast period. Values are in US dollars at the price paid by cell makers, with in-house production valued at equivalent market prices, converted at 2025 average exchange rates such as RMB 7.16 per US dollar. The market is segmented by cell format, component, vehicle type and region, with regions allocated by where cells are made.
Pack-level enclosures such as trays, lids and crash structures, module frames, cooling plates, busbars, active cell materials, and enclosures for energy storage, consumer and two-wheeler cells are excluded. This market sits inside the scope of the Marqstats Electric Vehicle Battery Components Market and does not overlap with the India EV Battery Casing Market, which covers pack-level enclosures; the figures should not be added together. Segment and regional splits are Marqstats estimates built on battery installation data, supplier financial results and enclosure price benchmarks.