
US motor oil sales are shrinking by volume. Industry revenue keeps climbing anyway.
In brief:
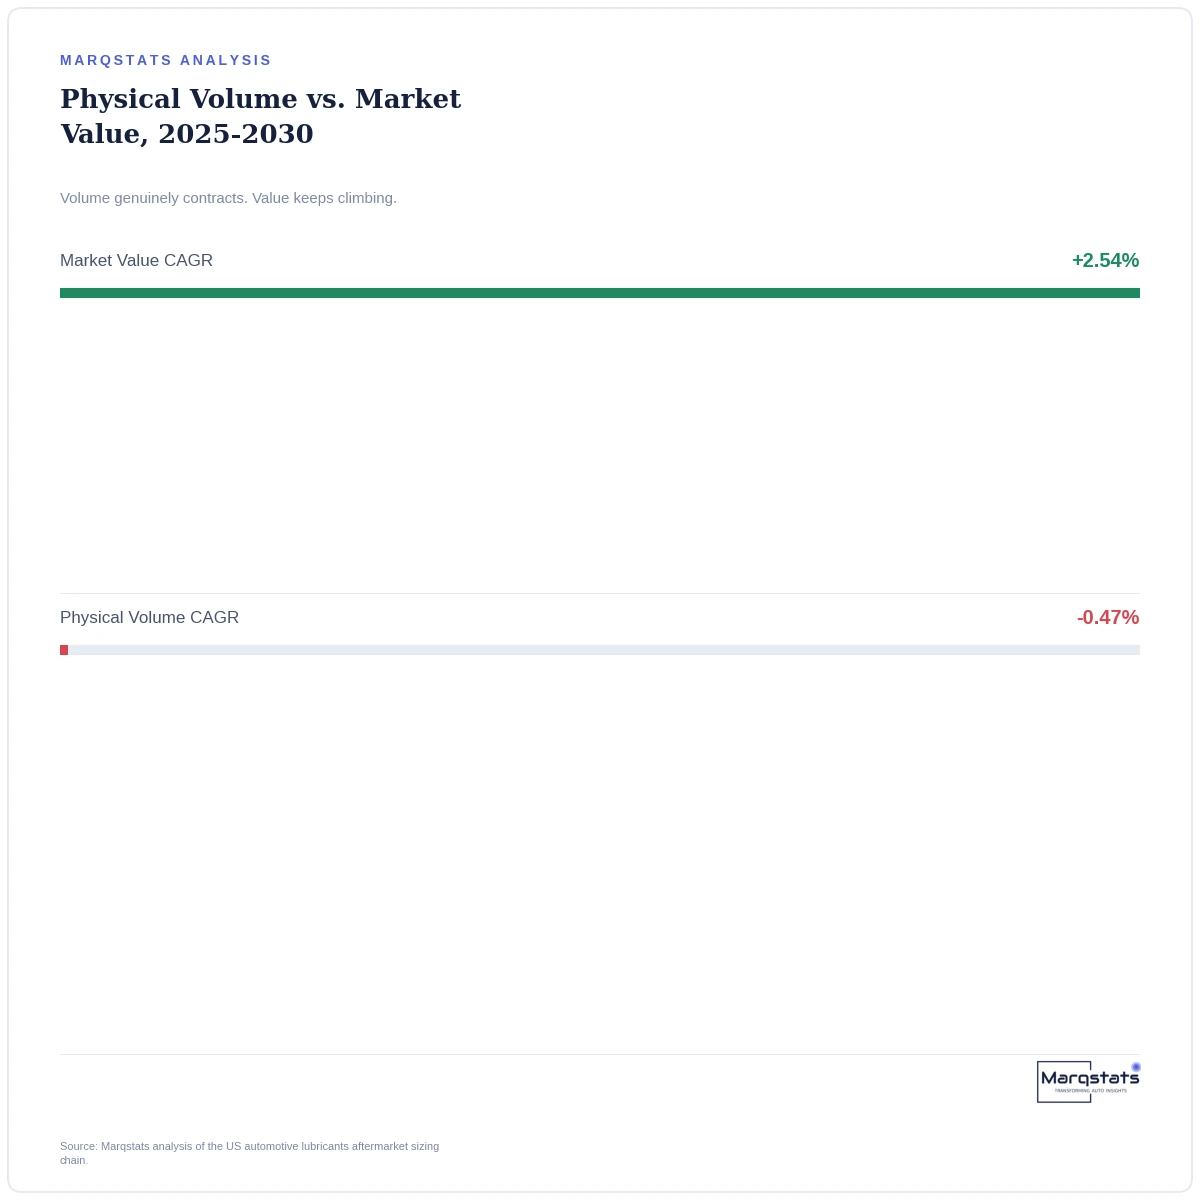
- US automotive lubricant volume contracts from 725.00 million gallons in 2025 to 708.10 million gallons by 2030, a -0.47% compound annual rate.
- Market value grows from $16.25 billion to $18.42 billion over the same period, a +2.54% compound annual growth rate.
- This is a genuinely unusual pattern: actual volumetric decline paired with accelerating dollar growth.
Most growing markets grow because more of something gets sold. The US automotive lubricants aftermarket is doing something less intuitive: selling less oil, in absolute gallons, while generating meaningfully more revenue from what it does sell. Fewer gallons, more dollars. It's worth understanding exactly why. It's a genuinely counterintuitive pattern for anyone used to reading unit sales as a proxy for market health.
Why volume is actually falling, not just plateauing
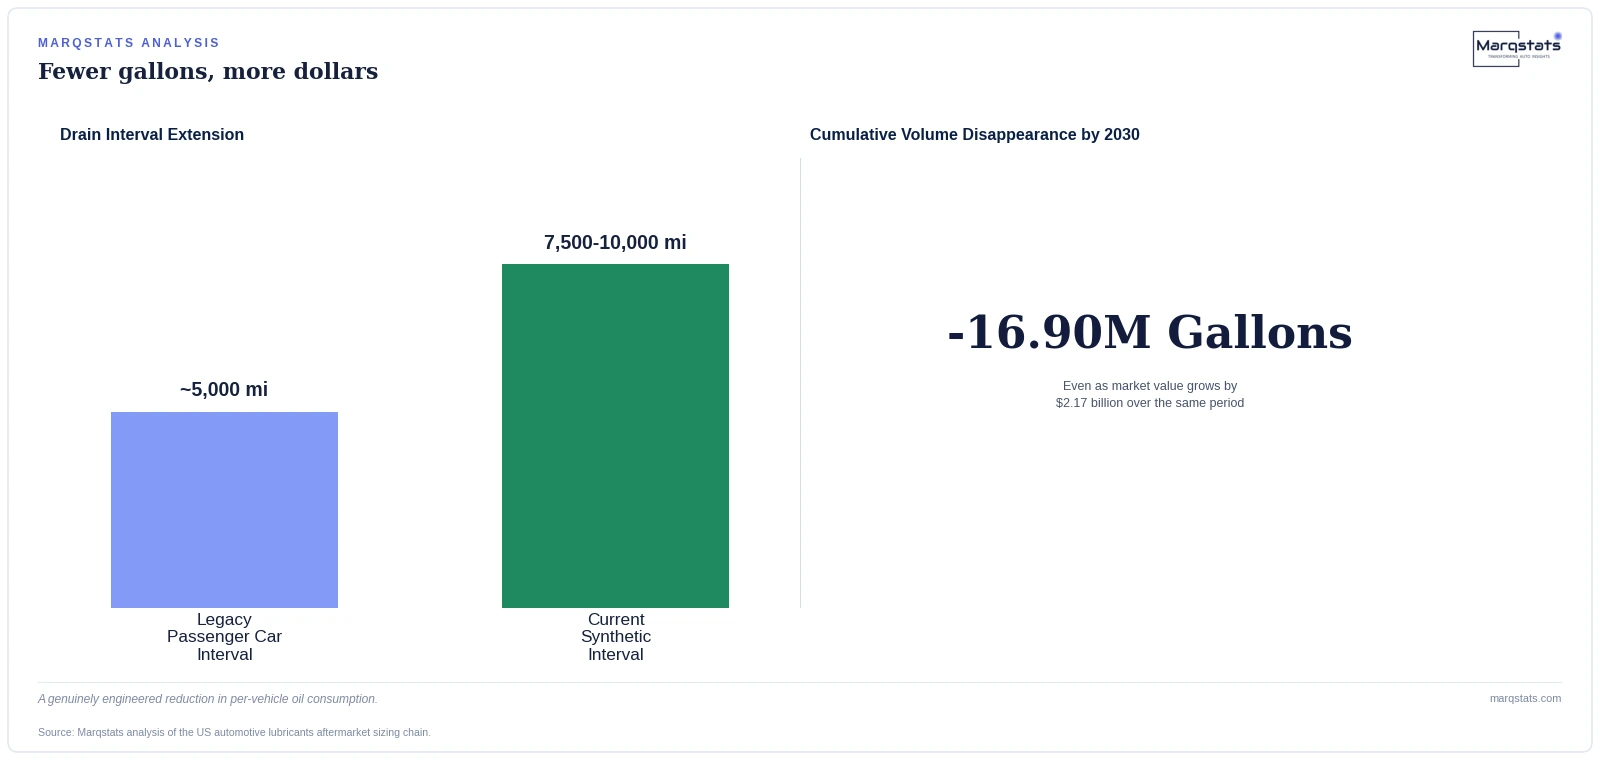
This is a meaningfully different story than a market simply growing slower than expected. Physical volume is genuinely contracting, from 725.00 million gallons in 2025 to a projected 708.10 million gallons by 2030. The primary driver is the prolongation of synthetic engine oil drain intervals, which now routinely reach 7,500 to 10,000 miles for passenger cars, up substantially from legacy service cadences, and exceed 60,000 to 80,000 miles in Class 8 commercial diesel fleets. Each individual oil change now covers meaningfully more driving distance than it used to, which mechanically reduces the total number of gallons the market needs to sell to service the same underlying vehicle fleet. That's a genuine change in how much oil a car needs over its lifetime, not just a slower sales quarter.
Fewer gallons are changing hands. Each one is worth considerably more.
— Marqstats Analyst Team
Where the growing dollar value is actually coming from
Two forces are elevating dollar value even as physical volume shrinks. First, premiumization: the market is rapidly migrating toward Group III and synthetic Polyalphaolefin base stocks that carry meaningfully higher wholesale realization than conventional mineral oils, a shift accelerated directly by ILSAC GF-7A, GF-7B and API SQ specifications that took effect 31 March 2025. Second, service model: the Do-It-For-Me installed service channel, which captures 81.48% of total dollar value despite only 72.80% of physical volume, continues gaining share over Do-It-Yourself retail as vehicle complexity increasingly locks home mechanics out of routine maintenance.
Why this pattern is genuinely unusual, not just a normal maturing-market story
Plenty of mature product categories see unit volume plateau while dollar value continues climbing on modest price inflation. What's happening here is more specific: the underlying product itself, a gallon of engine oil, now needs to last meaningfully longer in the vehicle, which structurally reduces how many gallons any given vehicle needs over its lifetime, even as the total vehicle fleet keeps growing. That's a genuine, engineered reduction in per-vehicle consumption, not simply softer demand or a temporary sales lull.
Why an aging fleet isn't offsetting the volume decline
It might seem like a record 12.80-year average fleet age, the oldest on record, should offset drain-interval-driven volume loss, since older vehicles typically burn more oil between changes due to degraded valve stem seals and ring pack wear. That effect is real, and it is captured in the market's Upside-leaning Baseline Trajectory Scenario specifically. But it's not strong enough on its own to flip the overall volume trend positive: the extended-interval effect, compounded across tens of millions of vehicles moving from 5,000-mile to 7,500-to-10,000-mile service cycles, is simply a larger structural force than the comparatively modest top-off consumption increase aging vehicles generate.
The counter-argument: could volume decline accelerate faster than this baseline forecast suggests, eventually dragging value growth down with it?
A fair concern is whether the current 2.54% value growth rate can really hold up if volume decline accelerates beyond the baseline -0.47% pace, particularly if battery-electric vehicle adoption moves faster than currently modeled, removing internal combustion vehicles, and their oil-change needs, from the fleet entirely. This is precisely the logic behind the market's own Conservative Volumetric Drag Scenario, which models exactly this acceleration, EPA Heavy-Duty Phase 3 enforcement combined with battery-electric sales reaching 15% of new registrations by 2028, and even under that more aggressive contraction scenario, value growth still remains positive, at a reduced but still real 1.03% CAGR, because premiumization continues even as the underlying fleet electrifies. The value growth engine appears durable across a meaningful range of volume outcomes, not narrowly dependent on the baseline case holding exactly as modeled.
What this means for market participants
- Lubricant blenders and distributors should track dollar-per-gallon realization as the primary growth metric for this market, rather than unit volume, given the structural, engineered nature of the ongoing volume decline.
- Investors evaluating this market should weight exposure toward premium synthetic formulation capacity and Do-It-For-Me installed service channels specifically, since nearly all forecast value growth concentrates there.
- Market participants planning capacity or distribution investment should model the Conservative Volumetric Drag Scenario explicitly, since it demonstrates value growth likely persists even under accelerated volume contraction.
Where the shrinking volume actually concentrates within the fleet
It's worth being specific about which vehicles are actually driving this volume contraction, since the answer isn't uniform across the fleet. Full synthetic formulations, which carry the longest drain intervals, are expanding fastest specifically within the light-truck, crossover and SUV segment, which commands 191.00 million units (66.09% of the light-duty fleet) and has captured more than 75% to 80% of new vehicle retail registrations over the preceding decade. As this segment's newer vehicles increasingly ship factory-filled with full synthetic oil rated for extended service intervals, it's disproportionately responsible for the aggregate volume decline, even though it's also the single largest fleet segment by vehicle count.
Passenger cars, by contrast, carry a smaller mean sump capacity of 3.80 to 4.80 quarts against light trucks' 5.50 to 8.00 quarts, meaning even comparable percentage shifts in drain interval or synthetic adoption produce a smaller absolute gallon impact per vehicle in the passenger car segment than in the light truck segment. The volume story, in other words, is disproportionately a light-truck story.
What this means for how the industry actually measures its own health
This decoupling has a genuine practical consequence for how industry participants should track their own performance. A lubricant blender or distributor that reports growth purely in gallons shipped would show a business in genuine decline over this period, even while the same business, measured in dollar revenue, is expanding at a healthy 2.54% annual rate. Neither number is wrong, they're simply answering different questions, and conflating them risks a genuinely misleading read on the business's actual trajectory. The more useful single metric for tracking this market's health is probably dollar-per-gallon realization specifically, since it isolates the premiumization effect from the volume effect and shows directly whether a given participant is capturing the value migration this market is undergoing.
The full market picture
Marqstats' complete United States automotive lubricants aftermarket analysis, including the full three-scenario forecast through 2030, is available in the linked report below.
Related reportUnited States Automotive Lubricants Aftermarket Size, Share & Forecast 2026 – 2030