
The World's Connected Cars Are Splitting Into Two Different Markets by Region
In brief: a single global "67% connected" statistic hides a genuinely two-tier world. Western Europe and North America are approaching saturation. Most of the rest of the planet is barely a third of the way there. And that gap is where nearly all of this market's future unit growth will actually come from.
The Regional Numbers in Full
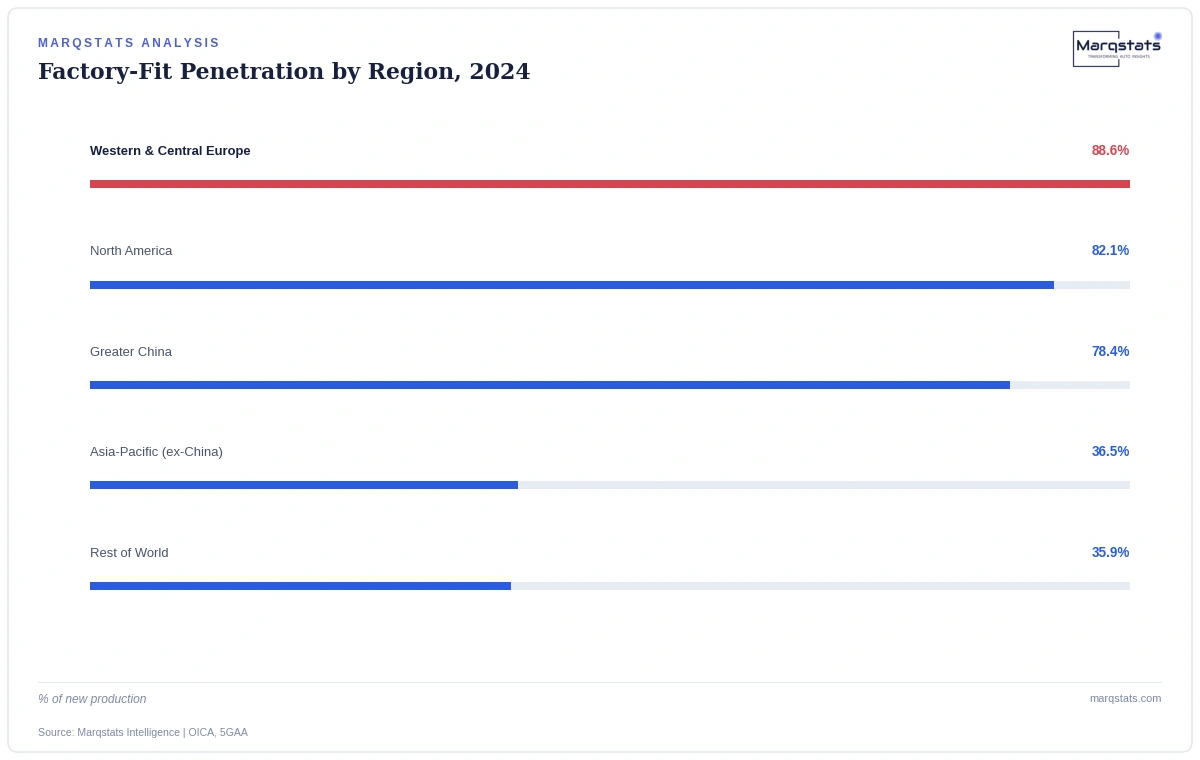
The underlying research's own regional breakdown makes the divide explicit. Western and Central Europe leads at 88.6% factory-fit penetration in 2024, followed closely by North America at 82.1% and Greater China at 78.4%. Then the numbers fall off a cliff: Asia-Pacific excluding China sits at just 36.5%, and the Rest of World — covering Latin America, the Middle East, Africa and other markets — sits at 35.9%. That's not a gradual decline across regions; it's two distinct tiers with almost nothing in between.
Why This Split Exists
The mature-tier regions share a common feature: mandatory regulatory requirements. The EU's NG-eCall Delegated Regulation and UNECE R155/R156 compel embedded connectivity across participating countries regardless of consumer demand; China's own GB/T 32960 standard plays a similar anchoring role domestically. The lagging-tier regions largely lack an equivalent regulatory forcing function, meaning connectivity adoption there depends far more heavily on vehicle price points, cellular infrastructure maturity and organic consumer or fleet demand — all of which move more slowly than a regulatory mandate does.
One global average hides two entirely different markets — one approaching saturation, one barely getting started.
— Marqstats Analyst Team
Why the Lagging Tier Is Where the Real Growth Story Is
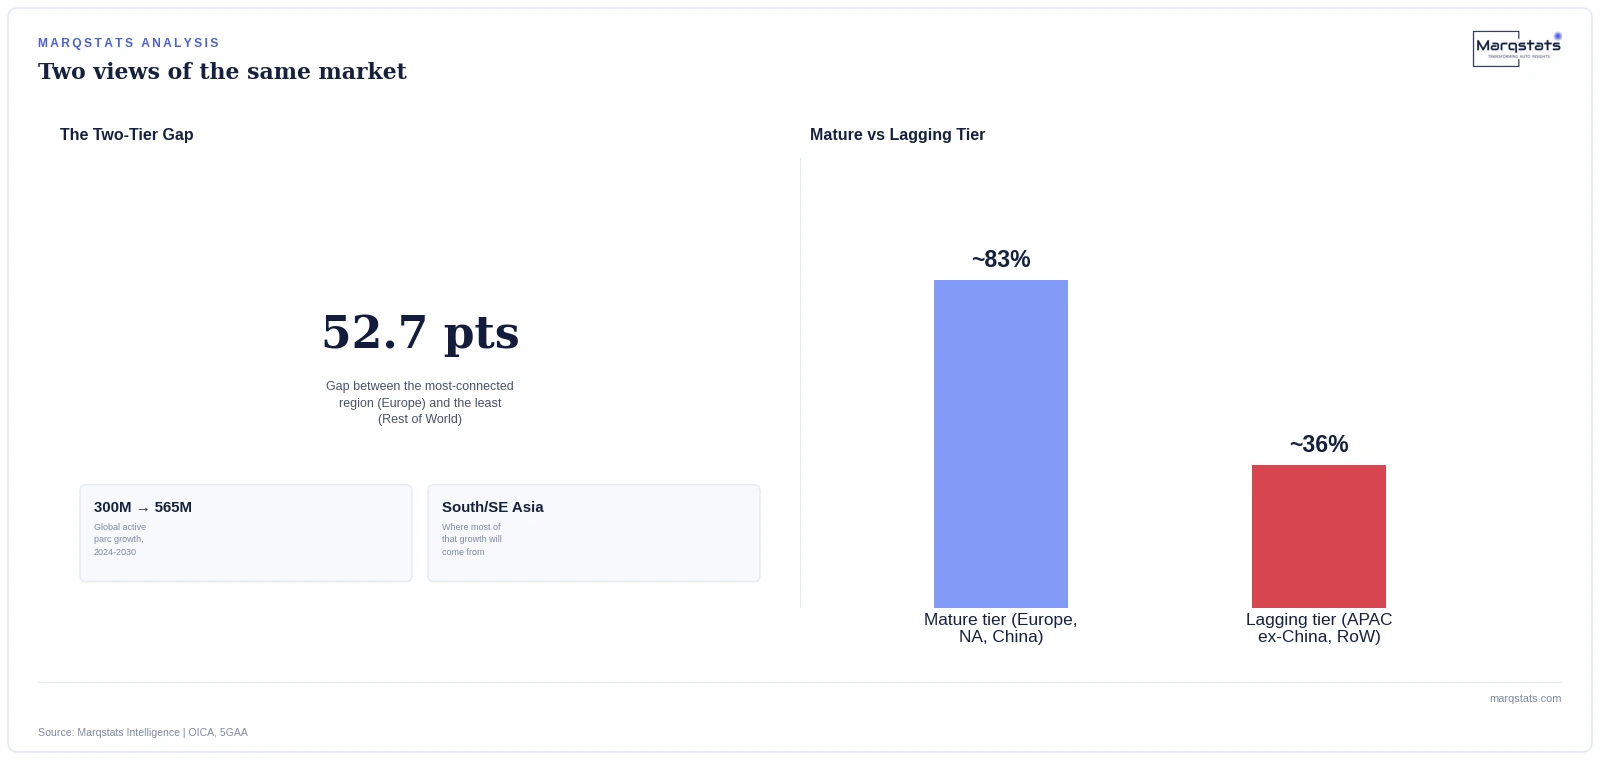
This distinction matters enormously for how the source's own headline unit-growth forecast should actually be read. The global active connected parc is projected to nearly double from 300 million in 2024 to 565 million by 2030 under the Baseline Scenario — but that growth isn't evenly spread. With Western Europe and North America already near ceiling, the bulk of that near-doubling has to come from somewhere, and the underlying research is explicit that industrializing automotive markets across South and Southeast Asia are the primary source.
What North America's Own Penetration Number Actually Hides
North America's 82.1% figure is itself worth a second look, since it blends a US market shaped heavily by federal supply-chain policy and state privacy enforcement with a Canadian market operating under a genuinely different, though related, regulatory framework — a reminder that even within the "mature tier," regional blocs in this report's own table still compress meaningfully different national stories into one blended percentage.
Why Greater China Sits Between the Two Tiers, Not Firmly in Either
Greater China's own 78.4% penetration figure deserves its own note, since it sits closer to the mature tier than the lagging one, but for a genuinely different reason than Europe or North America. China's high penetration reflects aggressive domestic industrial policy and GB/T 32960 compliance requirements rather than the kind of decades-long organic market maturation that produced Europe's own saturation — meaning China's own path to its current penetration level looked structurally different even though the resulting percentage lands in a broadly similar range.
The Practical Test for Reading Any Single Country's Number
A useful rule of thumb when reading any individual country or regional penetration figure in isolation: ask whether it reflects genuine organic market maturity built up over many years, or a comparatively recent, policy-driven acceleration. Both can produce an identical headline percentage, but they imply very different things about how stable that percentage is likely to be going forward and how much further room for additional policy-driven acceleration still exists in that specific market.
What This Means for Where Companies Should Actually Invest
An automaker, Tier-1 supplier or telecom operator reading the global growth forecast as evenly distributed demand would be planning around the wrong geography entirely. The genuine growth opportunity through 2030 sits overwhelmingly in the lagging-tier regions closing their own penetration gap, not in incremental share gains across already-saturated European or North American markets where the addressable new-vehicle population for further connectivity growth is already thin.
Why This Split Also Changes How Supply Chains Should Be Read
Tier-1 suppliers and hardware manufacturers face a genuinely different design brief depending on which tier they're building for: mature-tier markets increasingly demand premium 5G-capable, C-V2X-ready hardware at price points those saturated markets can absorb, while lagging-tier markets need genuinely cost-optimized 4G hardware that can hit far lower vehicle price points without sacrificing the basic connectivity features regulators or fleet operators require. A single global hardware roadmap optimized for one tier risks being the wrong product entirely for the other.
What a Corrected Regional Model Would Actually Require
A genuinely precise regional growth model would need country-level, not just regional-bloc-level, penetration trajectories — the Asia-Pacific-excluding-China bloc spans markets as different as Japan (already highly connected) and Indonesia or Thailand (still early-stage), and averaging them into a single 36.5% regional figure obscures genuinely different investment timelines within the same broad geography. This report's own regional table is the finest grain the underlying research provides; a country-by-country model would require assembling data this pack alone does not contain.
The Scale of Unit Growth This Actually Represents
It's a genuinely large, underappreciated opportunity by any reasonable standard, and one this analysis's own regional table makes concretely visible in a way the single global 67% headline figure never could on its own, once the regional breakdown is actually examined line by line rather than taken at face value as a single flat percentage.
Putting real numbers against the abstraction: closing even half the gap between the lagging tier's current ~36% penetration and the mature tier's ~83% average, across the roughly 30 million vehicles produced annually in Asia-Pacific excluding China and the Rest of World combined, would alone add several million newly connected vehicles a year — a genuinely material contribution to the source's own projected near-doubling of the global active parc by 2030, concentrated almost entirely in markets most Western industry commentary pays comparatively little attention to.
A Named Comparison: How India's Own Country-Level Data Confirms This Pattern
India, covered elsewhere in this coverage set, offers a concrete country-level illustration of exactly this dynamic: a connected vehicle fleet growing faster in units (22.38% CAGR) than in market value (19.30% CAGR), the signature of a market still in its hardware-accessibility expansion phase rather than the software-monetization phase mature markets have already entered — precisely the pattern this global regional split predicts for the broader Asia-Pacific and Rest of World tier.
What This Means for Automaker Product Portfolio Strategy
It's worth being fair to the counter-argument here too: standardizing on a single global connectivity specification does carry genuine manufacturing and validation cost savings that a tiered approach sacrifices, and for automakers with thinner engineering resources, that simplicity may still be the more defensible trade-off even if it leaves some regional revenue on the table in either direction.
Automakers selling globally face a related design tension: a single global vehicle platform optimized purely for mature-tier connectivity expectations risks pricing itself out of the lagging-tier volume opportunity entirely, while a platform optimized purely for lagging-tier cost points risks under-delivering on the connectivity features mature-tier regulators and consumers now expect as standard. The automakers navigating this most successfully appear to be the ones building genuinely tiered hardware and software configurations by region, rather than a single global connectivity specification applied uniformly everywhere.
What a Telecom Operator or Infrastructure Investor Should Actually Do
For a mobile network operator or infrastructure investor, this split suggests a genuinely different resource-allocation priority than simply chasing the largest existing connected-vehicle populations. The lagging-tier regions represent the segment where cellular infrastructure investment itself is often the binding constraint on connectivity adoption, meaning network buildout there can plausibly accelerate the underlying penetration curve directly, in a way that further infrastructure investment in an already-saturated European market simply cannot.
Outlook: One Trigger, Not Three
There's no single event that closes this regional gap quickly. It requires sustained automotive-market industrialization across dozens of individual countries simultaneously — rising vehicle price points, improving cellular infrastructure, and gradually strengthening local regulatory frameworks — a multi-year structural process rather than a policy switch any single regulator or company could flip.