Why South Korea's 35.91% Connected Car Growth Rate Isn't All Organic Demand
Part of it is a filing-cabinet change, not a genuine sales trend. South Korea's connected vehicle fleet grew at a 35.91% compound annual rate from 2018 to 2023, a figure regularly cited as evidence of exceptional market adoption. Some of that growth is real. Some of it is the direct, mechanical result of a single regulatory reclassification in October 2020 that moved millions of lines from one government statistical category into another — without a single additional vehicle being connected on the day it happened.
What Actually Changed in October 2020
Before October 2020, in-vehicle telematics lines from Hyundai and Kia specifically were aggregated directly under the Mobile Network Operators carrying them — SK Telecom, KT and LG Uplus. The Ministry of Science and ICT then recognized that Hyundai and Kia were operating their consumer telematics suites as private-label service packages, not simply as MNO customers, and moved their factory-installed lines into the Mobile Virtual Network Operator (MVNO) statistical category instead. Hyundai had registered as a specialized data-only MVNO in 2015, and Kia followed in 2020, both under Articles 6 and 21 of the Telecommunications Business Act.
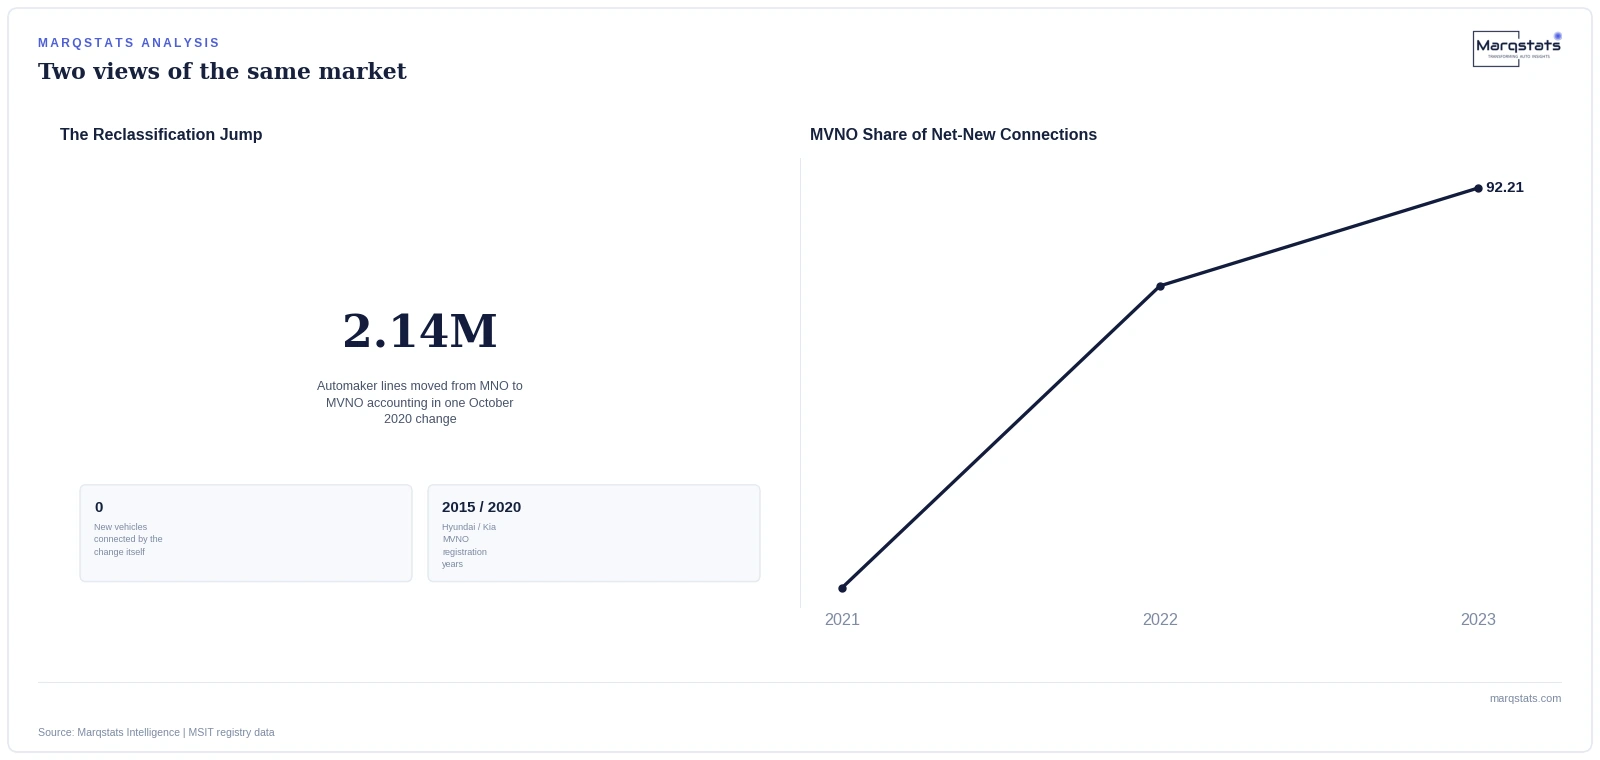
The mechanical effect was immediate: 2.14 million automaker lines transitioned from MNO to MVNO accounting in a single reporting change. Nothing about the underlying vehicles changed — the same cars, the same modems, the same connections — only which government ledger counted them.
Why This Matters for the Growth Rate Specifically
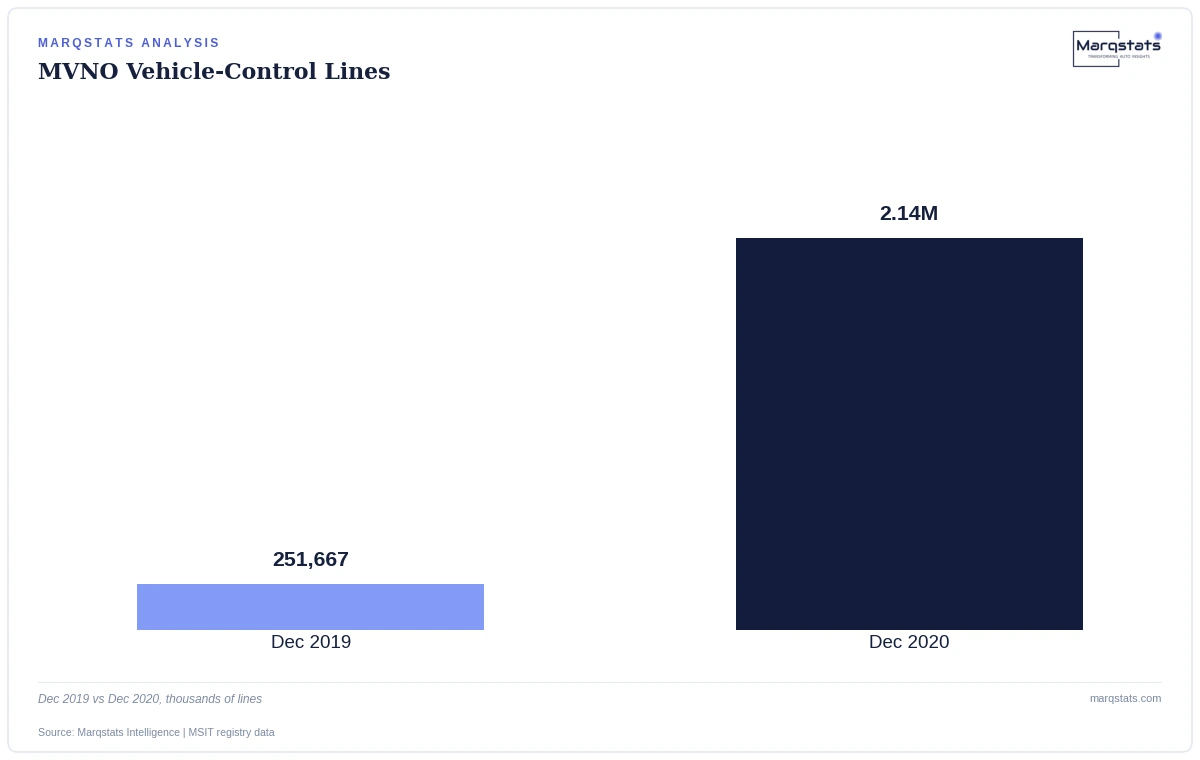
A compound annual growth rate calculated across a period that includes a one-time reclassification event will overstate the organic trend, because the reclassification itself shows up as growth in whichever category received the reclassified lines. The MVNO vehicle-control registry expanded from 251,667 lines in December 2019 to 2.14 million by December 2020 — a jump no plausible organic sales trajectory could produce inside twelve months, and one driven almost entirely by the reclassification rather than new connections.
The Better Number to Use
Between 2022 and 2023, specifically, MVNO subscriptions accounted for 92.21% of all net-new connected-vehicle line additions nationally. That concentration is informative in a different way than the headline CAGR: it confirms that by 2022 and 2023, genuine organic growth really was concentrated in the MVNO channel, driven by Hyundai Motor Group's standardization of factory telematics across mainstream trim levels. The distortion sits specifically in the 2018-to-2020 window, where the reclassification event lives; growth measured from 2021 forward, after the one-time statistical shift had fully worked through the registry, is a cleaner, more defensible read of actual market expansion.
The Counter-Case: Was the Reclassification Itself Wrong?
It is worth stating this plainly and clearly: MSIT's reclassification was not a statistical error — it was a genuine correction. Hyundai and Kia's lines were always functionally MVNO relationships once both automakers registered as specialized carriers; counting them as ordinary MNO connections before 2020 was arguably the less accurate classification. The distortion is not in the reclassification decision itself, but in using a growth rate that spans the reclassification date as if it measured a single, continuous trend.
A Comparable Case: How Carrier Statistics Get Contested Elsewhere
South Korea's carriers have separately disputed whether blending vehicle-control IoT lines into headline wireless-connection totals is fair at all, independent of the reclassification-timing question this piece focuses on. When LG Uplus's total wireless connections surpassed KT's for the first time in September 2023, KT publicly noted that its own base of high-ARPU consumer mobile handset subscribers remained substantially larger — 13.55 million against LG Uplus's 10.97 million — arguing that aggregating low-ARPU IoT lines with premium mobile subscribers distorts the comparison. That is a related but distinct critique: KT's complaint is about what should count at all, while the reclassification issue is about which growth-rate window fairly measures what already counts.
The distinction matters because it points to two entirely different fixes. Resolving the reclassification-timing issue only requires picking the right comparison years. Resolving KT's broader complaint would require the regulator itself to change what counts as a reportable wireless connection — a far bigger, and so far unaddressed, structural question.
How the Two Growth Stories Diverge Year by Year
Laid out year by year, the pattern is visible directly in the registry's own numbers. Fleet penetration moved from 7.67% in 2018 to 12.65% in 2020 — the year of the reclassification — to 18.05% in 2021, 25.96% in 2022, and 31.81% by the close of 2023. The single largest percentage-point jump in that sequence, from 2020 to 2022, happens immediately after the reclassification event, which is exactly the period where a reader needs to ask how much of the jump is measurement and how much is genuine new connections.
New-vehicle connected-sales penetration tells a cleaner story over the same period, because it was never affected by the reclassification at all — it measures the share of new cars sold connected, not which government ledger counts the resulting line. That figure moved from 42.1% in 2020 to 51.4% in 2021 to 59.2% in 2022, a steady, plausible organic curve with none of the reclassification-driven distortion the fleet-penetration figure carries.
Why No One Correction Fixes the Whole Series
A reader might expect a single adjustment factor to cleanly separate the reclassification effect from organic growth across the entire 2018-to-2023 period, but the registry does not support that kind of clean correction. The reclassification moved existing lines in one discrete event in October 2020; it did not change the underlying growth rate of new connections before or after that date. That means the correct approach is not to apply a blanket discount to the whole-period CAGR, but to treat 2020 itself as a break point and calculate separate, internally consistent growth rates on either side of it — exactly the year-by-year approach the previous section applied immediately above.
What This Means for a Sizing or Sourcing Model
Anyone citing South Korea's historical connected-vehicle growth rate should check carefully which years the calculation spans, because a period crossing October 2020 will overstate the organic trend by an amount the reclassification alone can explain. The full historical reconciliation this piece draws on is set out in the Marqstats analysis linked below.
Related reportSouth Korea Connected Car Market Size, Share & Forecast 2026 – 2030