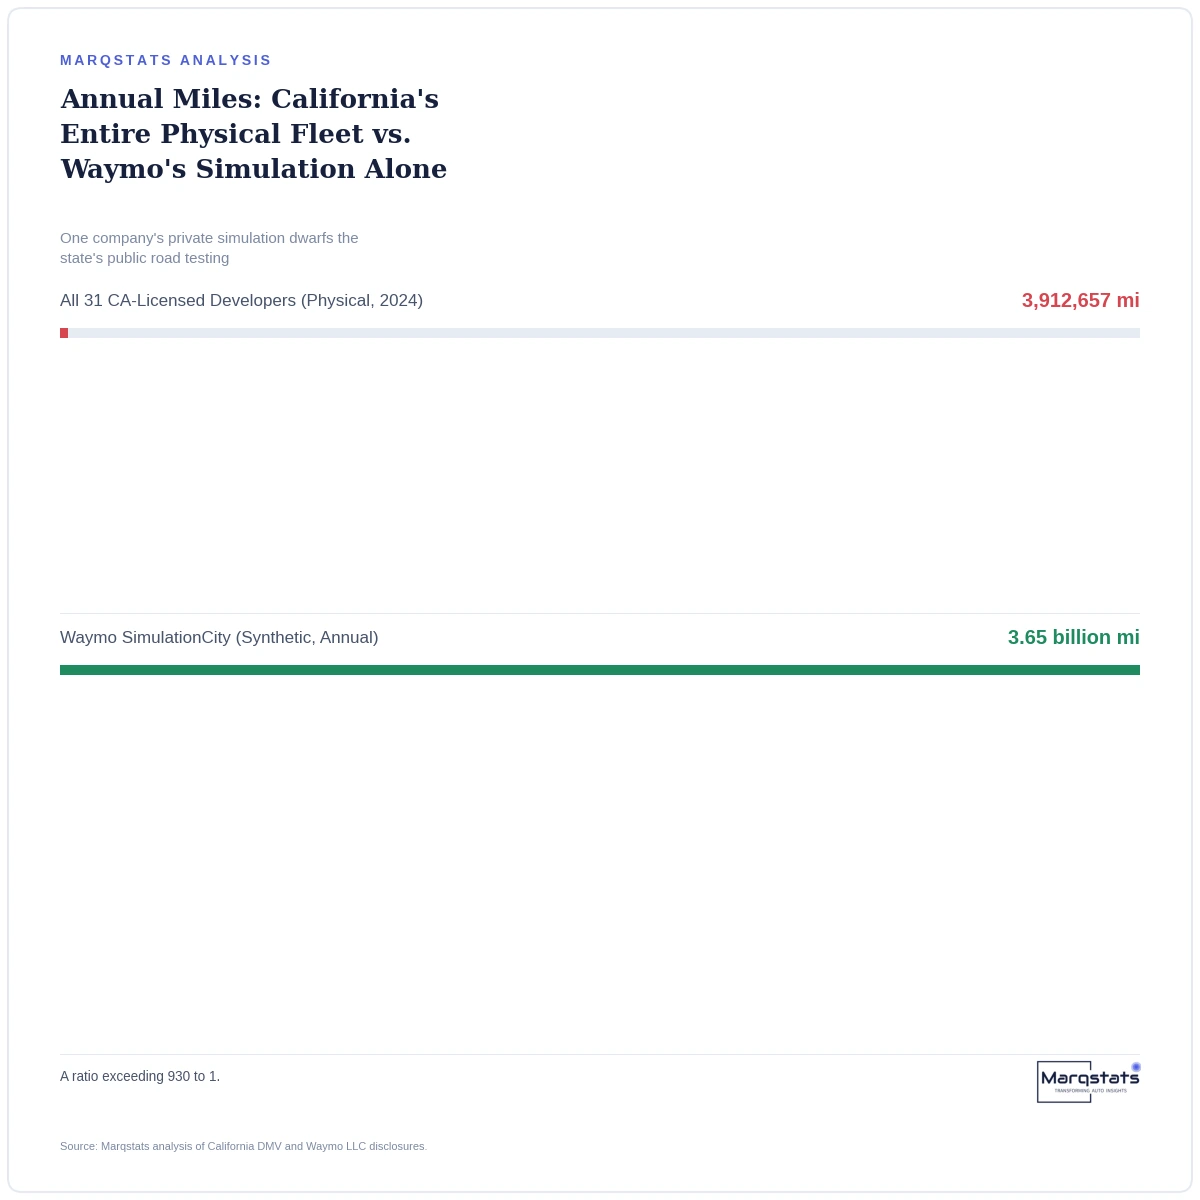
California's entire licensed self-driving fleet drove under 4 million miles in 2024. One company simulated 3.65 billion.
In brief:
- All 31 permitted autonomous vehicle developers drove an aggregate 3,912,657 test miles on California public roads in 2024.
- That figure fell 33.0% from 2023, driven substantially by General Motors' Cruise grounding its fleet after a pedestrian accident.
- Waymo LLC's proprietary SimulationCity engine alone generates an estimated 3.65 billion synthetic driving miles annually, over 930 times the entire state's physical total.
If you wanted to measure how much real-world driving is happening to validate self-driving car technology, California's own public disclosures would seem like the obvious place to look. The state requires every licensed autonomous vehicle developer to report their test mileage and any disengagements, and the resulting numbers are public record. In 2024, that public record shows 3,912,657 miles driven across all 31 permitted developers combined. That transparency is itself a genuine regulatory achievement - few other safety-critical technologies carry this level of mandated public reporting.
Compare that to what one single company is doing entirely outside public view.
Why the physical number actually shrank
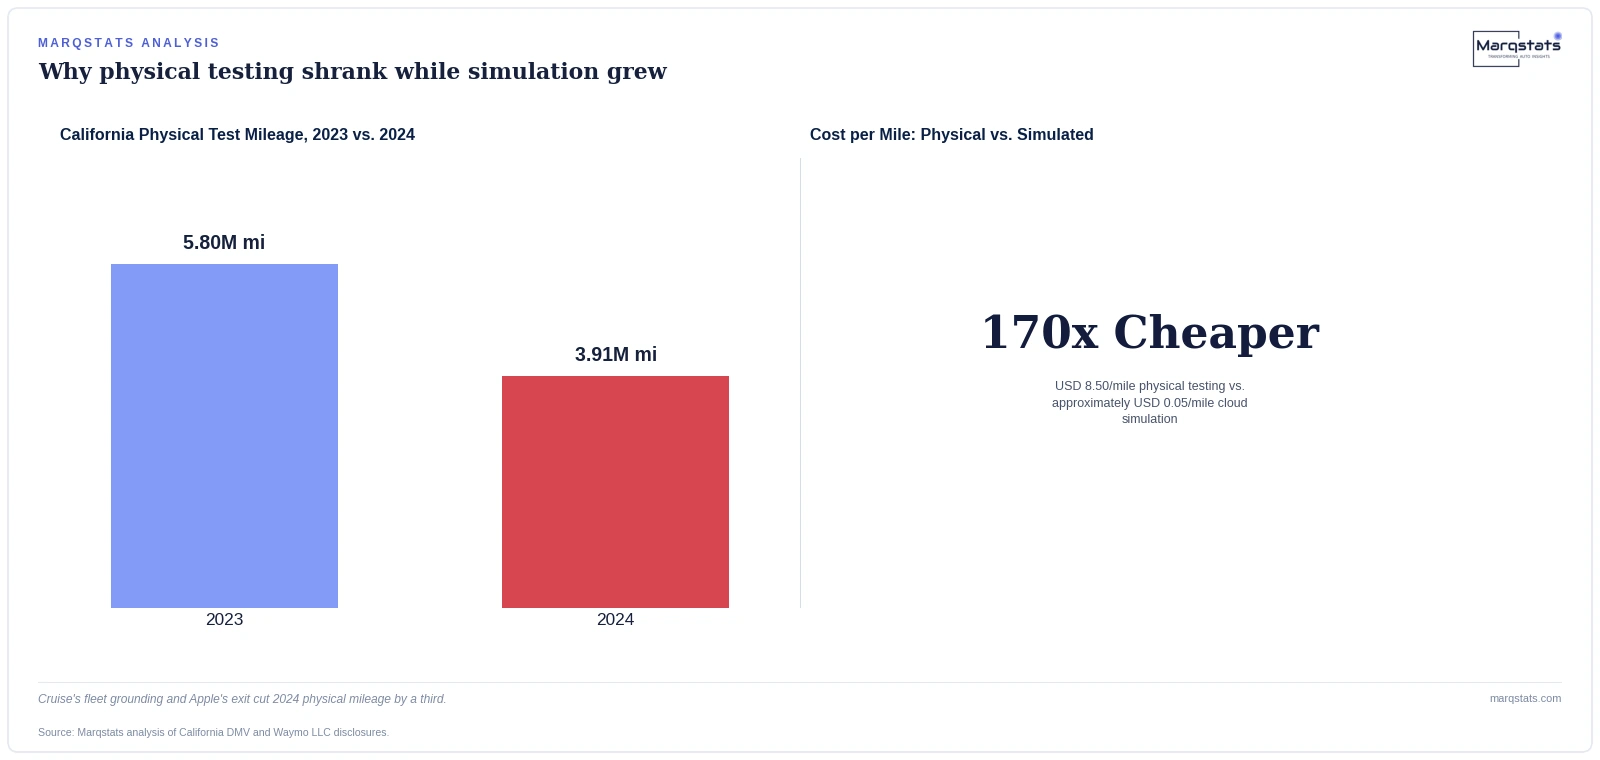
California's 2024 physical mileage wasn't just smaller than the simulated figure - it was smaller than the state's own prior year. The 3,912,657 miles recorded represents a 33.0% decline from the 5,801,069 miles logged in 2023. Two events explain most of that drop. General Motors' Cruise division grounded its entire 1,119-vehicle fleet following an October 2023 pedestrian accident in San Francisco. Apple Inc. terminated its autonomous vehicle project entirely. Both removed substantial physical testing volume from the state's public roads in a single year.
Meanwhile, the developers that kept operating expanded. Waymo grew its California fleet to 1,034 vehicles, logging 2,389,565 miles with safety drivers present plus 516,572 fully driverless miles. Zoox increased its own testing to 951,871 miles. The overall state total still fell, but the mix shifted toward fewer, larger operators. Zoox's expansion in particular reflects Amazon's continued investment in purpose-built robotaxi hardware and validation infrastructure through its 2020 acquisition of the company.
Physical road testing didn't just get smaller. It got smaller while private simulation kept growing.
— Marqstats Analyst Team
What Waymo is actually doing at that scale
Waymo's SimulationCity, its custom-built virtual testing environment first unveiled in July 2021 to replace an earlier system called CarCraft, runs continuously inside private cloud infrastructure. It generates synthetic sensor data, simulates traffic scenarios, and tests the company's driving software against scenarios that would be dangerous, rare, or simply impractical to encounter reliably on real roads - a pedestrian suddenly stepping into traffic from behind a parked truck, a sensor blinded by direct sun glare at a specific angle, an unusual combination of construction signage and lane closures.
None of this activity shows up in any California DMV report, because the DMV's reporting requirements are specifically built around physical, on-road testing. There is currently no equivalent public disclosure mechanism for simulated miles, GPU hours, or cloud compute spending.
Why the gap keeps widening, not narrowing
The scale disparity isn't an accident of one company's strategy - it reflects a genuine, durable cost difference. Operating a physical autonomous test vehicle, factoring in prototype depreciation, fuel, maintenance, depot logistics and safety driver salaries, costs a median of USD 8.50 per mile. Generating and running an equivalent mile of synthetic testing in the cloud costs approximately USD 0.05. That's roughly a 170-fold cost advantage for simulation, and it's not a temporary pricing quirk tied to any single vendor's promotional pricing - it reflects the structural economics of cloud compute versus physical vehicle operation.
The counter-argument: does simulated mileage actually substitute for real-world validation?
A fair objection is that raw mileage counts, physical or simulated, aren't directly comparable in value - a mile of routine highway driving teaches a self-driving system far less than a mile deliberately engineered to contain a rare, safety-critical edge case, and a huge simulated-mile total could simply reflect volume rather than genuine validation quality. This is a legitimate distinction. But it cuts in an interesting direction here: digital twin engines are specifically designed to target exactly the long-tail edge cases, like blinding glare or unexpected pedestrian movement, that physical vehicles rarely encounter across millions of routine public-road miles. The comparison isn't simply more miles versus fewer miles - it's whether targeted synthetic scenario generation can produce more safety-relevant learning per mile than largely uneventful physical driving, which is a case the industry believes but that isn't independently, publicly audited.
What this means for regulators and industry observers
- Regulators evaluating autonomous vehicle safety should recognize that physical road-mileage disclosure captures a shrinking, and possibly non-representative, fraction of total validation activity across the industry.
- Industry analysts comparing autonomous vehicle developers on safety grounds should seek simulation volume and methodology disclosure specifically, not rely on physical mileage figures alone.
- Policymakers considering expanded public reporting requirements should evaluate whether simulation-specific disclosure, coverage of edge-case scenario types rather than raw mileage, would provide more meaningful safety oversight than current physical-mileage-only rules.
Beyond mileage: what simulation eliminates that physical testing can't
The cost gap is only part of the picture - simulation also eliminates an entirely separate category of expense that physical testing carries regardless of mileage. Manually annotating real camera and lidar data, drawing 3D bounding boxes around objects, generating pixel-level segmentation masks, calculating optical flow vectors, costs between USD 1.20 and USD 4.50 per frame in human labeling work. A single mile of physical driving can generate hundreds of frames requiring this kind of manual annotation before the data becomes useful for training or validation.
Synthetic data sidesteps this entirely. Because a digital twin engine generates its scenes from a known, programmed ground truth, every synthetic frame arrives pre-labeled: semantic classes, surface normals, depth maps and object trajectories are all known exactly, with zero marginal labeling cost. This is a second, largely independent cost advantage stacked on top of the per-mile testing cost gap, and it compounds specifically for the perception-training use case that represents the largest single application segment in this market.
What regulatory blind spots this creates in practice
The absence of any public reporting requirement for simulation volume, cloud compute expenditure, or GPU hours creates a genuine asymmetry in what regulators and the public can actually observe. NHTSA's Standing General Order 2021-01 and the California DMV's disengagement reporting rules were both built around a physical-testing paradigm, requiring disclosure of on-road incidents and mileage. Neither framework requires any disclosure about the scale, methodology, or outcomes of private simulation testing - even though, by the scale comparison here, simulation now represents the overwhelming majority of actual validation activity happening across the industry.
This isn't necessarily evidence of regulatory failure - reporting frameworks built years before simulation reached this scale would naturally lag behind a shift of this magnitude. But it does mean that current public oversight mechanisms cover a demonstrably shrinking, and possibly decreasingly representative, share of the total safety validation work occurring across the autonomous vehicle industry.
The full market picture
Marqstats' complete United States automotive digital twin synthesis software market analysis, including the full physical-versus-virtual testing reconciliation, is available in the linked report below.
Related reportUnited States Automotive Digital Twin Synthesis Software Market Size, Share & Forecast 2025 – 2030