
Why We Had to Build Norway's Connected Car Market Size From Scratch
Every other national connected-car market we've analyzed in this coverage set arrives with at least a stated dollar figure to start from — sometimes wrong, sometimes needing correction, but always a number. Norway's research broke that pattern entirely. It documents fleet composition, registration trends, carrier pricing and a real company's audited financials in genuine depth. It contains no total market value anywhere in its text. Here's how we built one anyway, and why you should treat the result differently than a sourced figure.
What Was Actually in the Research
The underlying material is not thin at all — it is simply structural rather than commercial. It documents Norway's passenger fleet reaching 2,905,616 units by year-end 2025, BEVs overtaking diesel as the largest powertrain category, and new-registration BEV share hitting 95.6%. It names ABAX Group's FY2024 revenue (NOK 819.7 million) down to the gross-margin percentage. It states Tesla's exact Premium Connectivity price (129 NOK per month) and Telenor's enterprise IoT tariffs (20–29 NOK per month). What it never does, anywhere, is add any of this up into a connected-car market total.
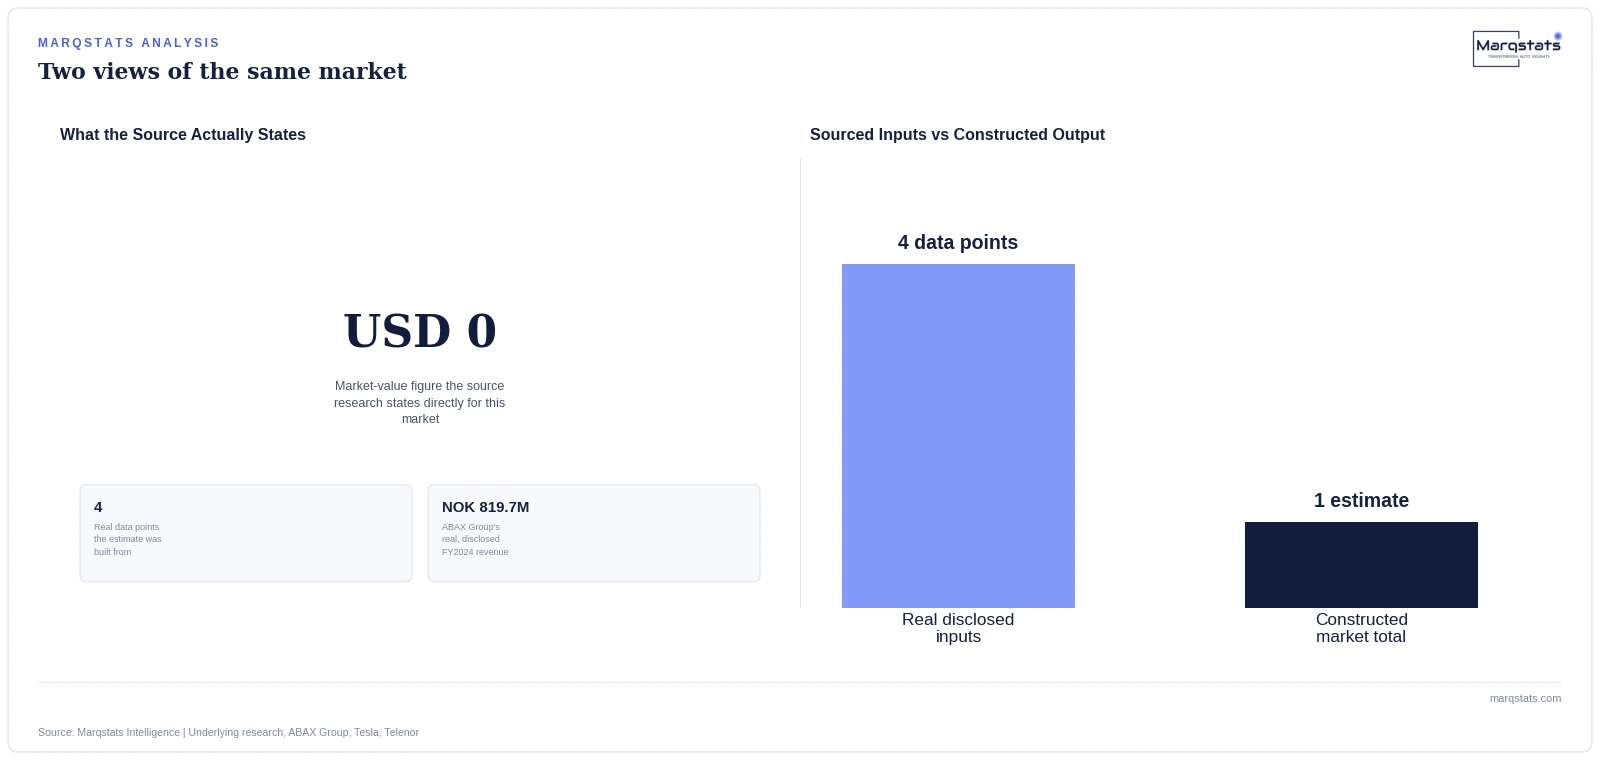
This kind of gap is genuinely unusual for research this detailed. Most market-research writing that goes deep enough to name a single company's EBITDA margin also, at some point, rolls that detail up into a category total — that's usually the entire point of gathering the detail in the first place. Norway's material reads more like a structural policy brief than a commercial market study, which is a genuinely different kind of document with a genuinely different purpose, even though it happens to contain nearly everything a genuine market-sizing exercise would need as raw material to work with, however that raw material eventually gets converted into a usable total.
The Four Numbers We Actually Built On
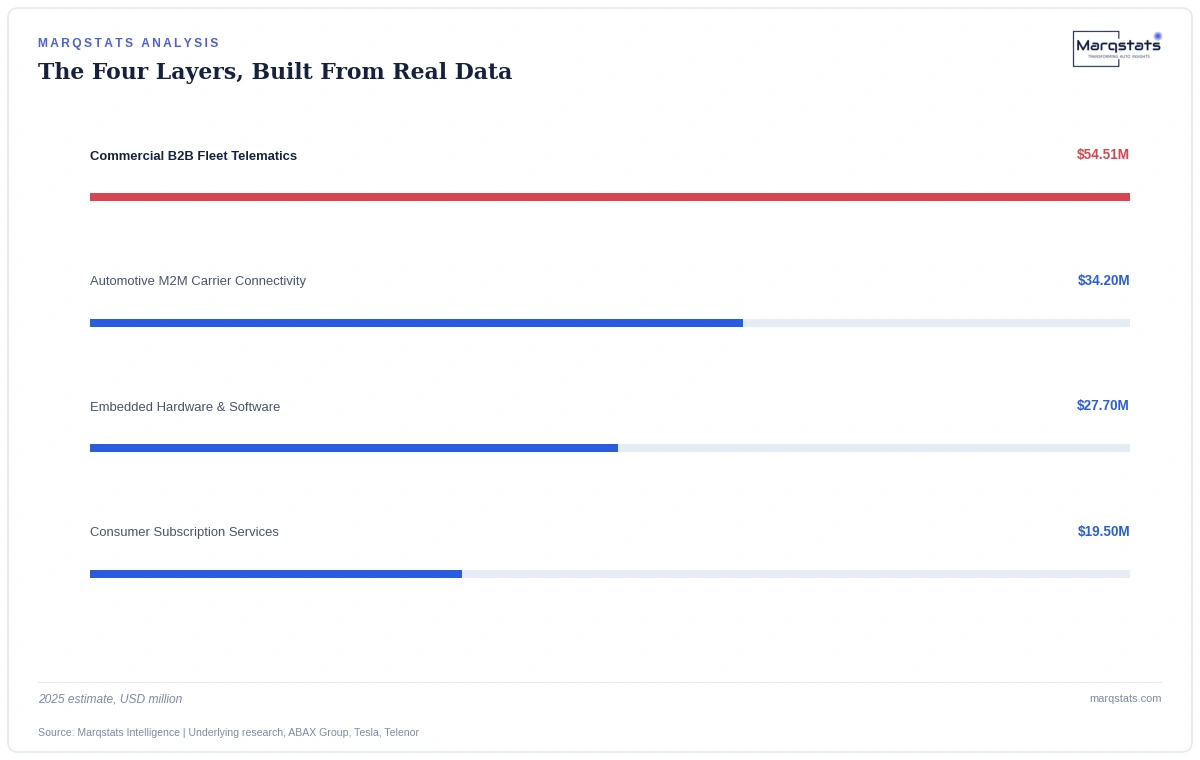
We estimated four separate revenue layers, each anchored to a real data point the research does provide. Embedded hardware value came from multiplying new 2025 registrations by an assumed average telematics hardware-and-software value per vehicle. Consumer subscription revenue came from Tesla's actual disclosed price, applied against an estimated paying-subscriber base. Commercial B2B fleet telematics came from ABAX Group's own real FY2024 revenue, apportioned to Norway specifically and adjusted upward for other named providers the research also documents. Automotive M2M connectivity came from Telenor's disclosed tariff tiers, applied against an estimated automotive-specific SIM count.
The single largest layer in the final estimate turned out to be commercial B2B fleet telematics, which makes intuitive sense given it is also the layer built on the most solid single data point — a real company's real, audited annual revenue. The smallest layer, consumer subscription services, reflects both Tesla's own generous free-connectivity bundling and the broader pattern this coverage set has documented elsewhere: consumers converting to paid connected-car subscriptions at consistently low rates almost everywhere they've been measured directly.
Why This Matters for How You Use This Number
A market-size figure built this way is not the same kind of number as one a source publishes directly, and it shouldn't be treated as interchangeable with one. It is directionally reasonable — every input is a real, disclosed figure, not a guess pulled from nowhere — but the multipliers connecting those inputs to a total are Marqstats assumptions, and different reasonable assumptions would produce a meaningfully different total. Anyone using this figure in a board deck or an investment model should know that distinction exists before citing it as confidently as they might cite a number France or Japan's own research already stated directly.
That said, the trend direction — growth driven by commercial fleet adoption and electrification rather than consumer demand — is far more robust than the specific dollar figures, since it rests on qualitative patterns the source research documents extensively and consistently, not on any single multiplier this analysis had to invent.
The Counter-Case: Isn't This Just Guessing?
It's a fair question, and the honest answer is that it's closer to informed estimation than pure guessing, but it is genuinely less certain than a sourced figure. Every single input number in this construction is real and traceable to a specific disclosure — that's meaningfully different from inventing a market size with no anchor at all. But the multipliers connecting those real inputs together — how many vehicles per year get an average of exactly how much embedded hardware value, what share of ABAX's multi-country revenue is Norway-specific — are judgment calls, not measurements, and we've tried to make every one of those judgment calls visible rather than hidden inside a single clean-looking total.
What We'd Need to Turn This Into a Real Sourced Figure
The path to converting this from an estimate into a genuinely sourced figure is fairly specific: a Norway-specific revenue breakdown from ABAX Group or its Nordic competitors, a published consumer-subscription conversion rate from at least one major OEM operating in Norway, and a carrier-published breakdown separating automotive M2M SIMs from the broader industrial and smart-grid M2M base. None of these three data points currently exist in public form, which is precisely why this construction had to happen in the first place.
A Named Comparison: How Japan and Indonesia Handled Similar Gaps
Norway isn't the first market in this coverage set to require a disclosed construction rather than a sourced total. Japan's own research carried no province-level regional breakdown; Indonesia's carried no formal value-based segment split. In both cases, the response was the same principle applied here: build what can be reasonably estimated from real data, disclose exactly how, and let the reader weigh the result accordingly rather than presenting a constructed number with the same confidence as a sourced one. Norway's gap is simply larger — the entire market total, not one dimension of it — which is why this piece exists specifically to walk through the construction in detail rather than leaving it to a single footnote.
What This Means for a Sizing or Sourcing Model
Anyone using Norway's connected-car figures should weight the underlying unit-level and company-specific data points more heavily than the constructed USD totals themselves. The full construction methodology this piece describes is set out in the Marqstats analysis linked below.
Related reportNorway Connected Car Market Size, Share & Forecast 2026 – 2030