Statistics & Highlights

Market Snapshot

Market size in USD Billion
$71.00B
2025
Base year
$80.61B
2026
Estimated
  
$133.90B
2030
Forecast
Largest market
China (by volume)
Fastest growing
United States
Dominant segment
Battery Electric (BEV)
Concentration
Fragmented
CAGR
13.53%
2026 – 2030
GROWTH
+$62.90B
Absolute
STUDY PARAMETERS
Base year2025
Historical period2021 – 2025
Forecast period2026 – 2030
Units consideredValue (USD BN)
REPORT COVERAGE
Segments covered4 segments
Regions covered4 regions
Companies profiled20++
Report pages300+
DeliverablesPDF, Excel, PPT
Executive Summary

Key Takeaways

Global used-EV volume reached about 3.65 million units in 2025 on roughly USD 71 billion of gross merchandise value, and is forecast to reach about 7.60 million units and USD 133.90 billion by 2030.
China is the largest and most liquid market by volume (about 44% of units, 1.6 million used NEVs in 2025), while Europe leads by value at roughly 50% of the global total.
The United States is the fastest-growing major region, propelled by an off-lease supply wave, even though it remains the smallest of the three big blocs by volume.
Battery-electric vehicles dominate the used mix worldwide as new-market BEV share rises, though used plug-in hybrids are gaining quickly in China.
Value grows more slowly than units—unit volume compounds near 16% a year while value compounds about 13.5%—because average used-EV prices have fallen sharply in China and Europe.
Battery state-of-health transparency is the decisive global trust variable, reinforced by the EU battery passport and the spread of battery-condition scoring on used-vehicle listings.
Market Insights

Market Overview & Analysis

Report Summary

The global used EV market comprises second-hand passenger vehicles powered by battery-electric or plug-in hybrid drivetrains, resold through franchised and independent dealers, OEM certified pre-owned programs, online and digital retail, fleet and lease remarketing, wholesale auctions, and cross-border export. Sized on a gross-merchandise-value basis, the market was worth an estimated USD 71 billion in 2025 on about 3.65 million transactions, consolidating China, Europe, the United States, and the Rest of World. The defining shift is structural: the market has moved from awareness-led adoption to a remarketing-led operating model shaped by lease maturity, residual-value management, and battery transparency.

Regional roles diverge sharply. China is the volume and liquidity leader, with 1.6 million used NEV transactions in 2025—7.9% of a used-car market that topped 20 million for the first time—but the toughest residual-value environment, where roughly 80% of dealers refuse battery-electric vehicles older than five years. Europe is the value leader, its fleet-fed supply and higher price points making it the largest region by gross merchandise value, anchored by a three-to-six-year ex-lease sweet spot. The United States is the fastest-growing major region, where an off-lease wave—more than 56% of new EVs were leased in the third quarter of 2025—is converting ad-hoc trade-ins into a structured used pipeline.

Pricing dynamics differ by region but share a direction. China is the harshest residual environment, with average resale values near 42% of original by late 2025; Europe reset from about 50% battery-electric retention in 2022 to roughly 35% in 2025 before beginning to normalize; and the United States saw the most visible volatility after 2023 new-vehicle price cuts before values recovered in 2026. Across all three, used-EV values now react quickly to new-vehicle incentives, fuel prices, and battery-confidence signals, which is why remarketing sophistication—not raw inventory—increasingly separates winners from the field.

The Rest of World is an increasingly relevant fourth pillar. Electric-car sales outside the three major new-EV markets reached nearly 2 million in 2025, enlarging the future global used-supply base, and used-vehicle imports remain central in regions such as Africa, where a large share of annual additions to car stock are imported used cars. Inspection-backed platforms are beginning to route used electric vehicles from China and other exporters into these markets, though after-sales support and battery inspection remain constraints.

Battery health has become the decisive global value variable, and the infrastructure to price it is maturing fast. Large-scale telematics analysis of more than 22,000 electric vehicles found average pack degradation of only about 2.3% per year, yet buyer perception still lags the data, so independent state-of-health certificates, battery-condition scores on listings, and OEM-backed warranties increasingly determine both transaction speed and price. Europe is codifying this trust layer through a digital battery registry and forthcoming battery passport, China through battery-swap and reconditioning ecosystems, and the United States through battery scoring on listings. Financing is both a demand driver and a future supply driver: as leasing became the dominant acquisition method for new EVs, used supply growth is now largely pre-programmed, shifting residual-value risk onto lessors and captives and making remarketing sophistication central to the market’s economics.

Market Dynamics

Key Drivers

Worldwide off-lease and fleet-return supply wave: the first large cohorts of leased and corporate-fleet EVs are entering the second-hand market across the U.S., Europe, and China at scale.

Affordability versus new EVs: used electric cars widen access to price-sensitive households globally, led by three-to-six-year-old vehicles in Europe and sub-USD 25,000 vehicles in the U.S.

Rising battery transparency: state-of-health certification, battery scoring on listings, and the EU battery passport convert battery condition into a priced, portable trust signal.

Rising BEV share of new-vehicle sales feeds an increasingly battery-electric used-supply base, broadening model choice and financing eligibility.

Fuel-cost sensitivity and professionalizing remarketing—auctions, superstores, and digital retail—lift used-EV consideration and improve price discovery worldwide.

Key Restraints

Residual-value volatility and depreciation: China is the harshest environment (~42% resale by late 2025), Europe reset from ~50% to ~35% retention, and U.S. values have been volatile.

Battery-health anxiety: despite average degradation of only about 2.3% per year, buyer uncertainty over range loss and replacement cost still suppresses demand for older vehicles.

Fragmented data and inconsistent standards across regions complicate cross-border pricing, sourcing, and benchmarking.

Insurance and repair frictions: EV repair costs have run about 25% higher and repair times about 14% longer than for comparable combustion cars, raising write-off risk.

Key Trends

Battery state-of-health certification and the EU battery passport are becoming global standards, making battery condition a merchandised, traceable attribute.

Regional divergence is widening: China leads on volume, Europe on value, and the United States on growth rate, each requiring a different operating playbook.

Used-EV exports to emerging markets are rising, with inspection-backed platforms opening corridors into Africa and the Middle East.

Digital and omnichannel retail continues to scale, and the winning model is shifting from simply holding EV stock to sourcing, certifying, financing, and remarketing it.
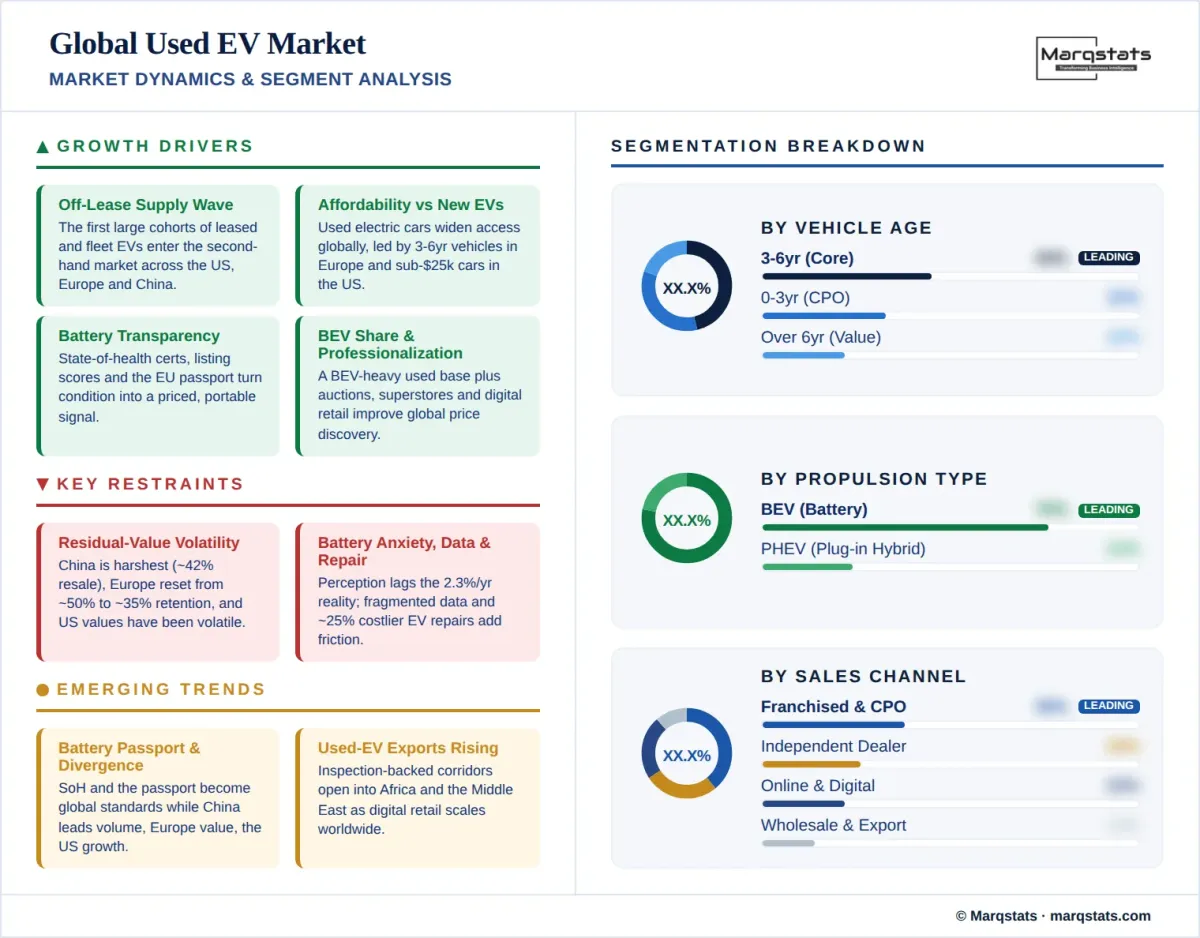
Global Used EV Market Market Dynamics Segment Analysis Infographic
Segment Analysis

Market Segmentation

Battery Electric Vehicle (BEV)
Leading

Battery-electric vehicles dominate global used-EV volume, reflecting rising BEV penetration of new-vehicle sales across every major region. BEVs also drive the market’s pricing signals, since new-vehicle price moves cascade quickly into used values, and battery state-of-health and warranty transferability are the decisive trust variables that separate fast-selling stock from stranded inventory.

Plug-in Hybrid Electric Vehicle (PHEV)

Plug-in hybrids are a meaningful and, in China, fast-rising share of used supply. They appeal in markets with weaker charging access and to buyers seeking a transitional option, and their residual values tend to be steadier than BEVs. Globally, however, the used mix tilts progressively toward battery-electric as newer BEV cohorts mature into the second-hand channel.

0–3 Years (Near-New / CPO)
Leading

Sub-three-year vehicles are largely ex-lease, ex-demonstration, and certified pre-owned stock. They retain the strongest battery warranty and command the highest ticket values, behaving commercially more like the nearly-new market and anchoring OEM CPO programs worldwide.

3–6 Years (Core Demand)

The three-to-six-year band is the global demand core—affordable yet still warranty-intact—and is especially pronounced in Europe, where these ex-fleet BEVs sell fastest, in an average of about 25 days. This cohort is fed directly by the maturing off-lease and fleet-return pipeline and carries the best combination of remaining battery warranty, condition, and financing eligibility, making it the primary battleground for certified retail worldwide.

Over 6 Years (Value Tier)

Vehicles older than six years anchor the affordability and export tiers but are the most exposed to battery-health scrutiny and, in China, to sharp dealer aversion. They depend heavily on independent battery certification and increasingly migrate toward value channels and emerging-market exports.

Franchised Dealer & OEM Certified Pre-Owned (CPO)
Leading

Franchised dealers and manufacturer-backed CPO programs command the trust-sensitive, higher-value end of the market, bundling inspection, transferable battery warranty, and financing. OEMs are expanding factory-certified used channels globally to defend residual values and retain customers.

Independent Dealer

Independent dealers move a large share of value-tier and older used EVs, competing on price and inventory breadth. Battery-health certification and warranty wraps are increasingly essential for this channel to convert price-sensitive buyers, particularly for older cohorts where OEM-backed reassurance is absent and battery condition drives the buying decision.

Online & Digital Retail

Online-first and digital platforms continue to gain share by pooling demand and simplifying purchase, delivery, and financing. Their share is rising fastest where digital infrastructure is mature, though battery and warranty complexity still favors inspection-backed professional sellers.

Wholesale & Export

Wholesale auctions and cross-border export absorb residual-risk and older stock, redistributing inventory across regions. Export corridors into emerging markets are expanding, though after-sales support and battery inspection remain constraints. Digital wholesale marketplaces are deepening EV-specific inspection and battery-scoring capabilities, helping match residual-risk inventory to the channels—and geographies—where it can be sold most profitably.

Off-Lease & Fleet Returns
Leading

Off-lease and fleet returns are the dominant and most predictable supply source, especially in Europe and the United States, where leasing and company-car channels pre-programme used inventory three to four years in advance with consistent condition, mileage, and title quality.

Private Trade-In

Private trade-ins and first-owner churn are the larger source in China and in markets with higher private new-car ownership. This supply is less standardized, which continues to favor professional, inspection-backed sellers over pure peer-to-peer transactions.

Regional Analysis

By Geography

China

China is the world’s largest and most liquid used-EV market by volume, with 1.6 million used NEV transactions in 2025—about 44% of global units and 7.9% of a used-car market that topped 20 million for the first time. It is also the toughest residual environment, with average resale values near 42% by late 2025 and roughly 80% of dealers declining battery-electric vehicles older than five years, concentrating liquidity in young stock. Its channels are professionalizing rapidly—cross-regional circulation reached a 34.9% transfer rate in December 2025—and inspection-backed platforms are beginning to export used electric vehicles to emerging markets.

Europe

Europe is the largest region by value, at roughly half the global total, reflecting fleet-fed supply and higher price points across its five largest markets—Germany, the United Kingdom, France, Italy, and Spain. Used electric cars reached about 4% of used-car transactions in 2025, up from 1% in 2021, and the three-to-six-year ex-lease band is the demand sweet spot as residual values normalize after a sharp reset.

United States

The United States is the fastest-growing major region, driven by an off-lease supply wave—more than 56% of new EVs were leased in the third quarter of 2025—and by affordability, with about 40% of used EVs priced under USD 25,000. It remains the smallest of the three big blocs by volume (roughly 373,000 transactions in 2025) but commands high value per unit and re-accelerated on rising fuel prices in 2026. Off-lease volumes are set to expand sharply as EV lease maturities climb toward an estimated 23% of maturities by 2028, giving the United States the highest projected growth rate among the major regions.

Rest of World

The Rest of World is an emerging, import-fed pillar. Electric-car sales outside the three major new-EV markets reached nearly 2 million in 2025, enlarging the future used-supply base, and used-vehicle imports remain central in regions such as Africa, where a large share of annual additions to car stock are imported used cars. Inspection-backed exporters are beginning to route used electric vehicles into these markets, subject to after-sales and battery-inspection constraints. As domestic fleets electrify and imported used stock grows, the Rest of World is expected to be the fastest-growing grouping in percentage terms over the forecast period, even though affordability and after-sales support—rather than OEM certification—remain the decisive purchase factors.
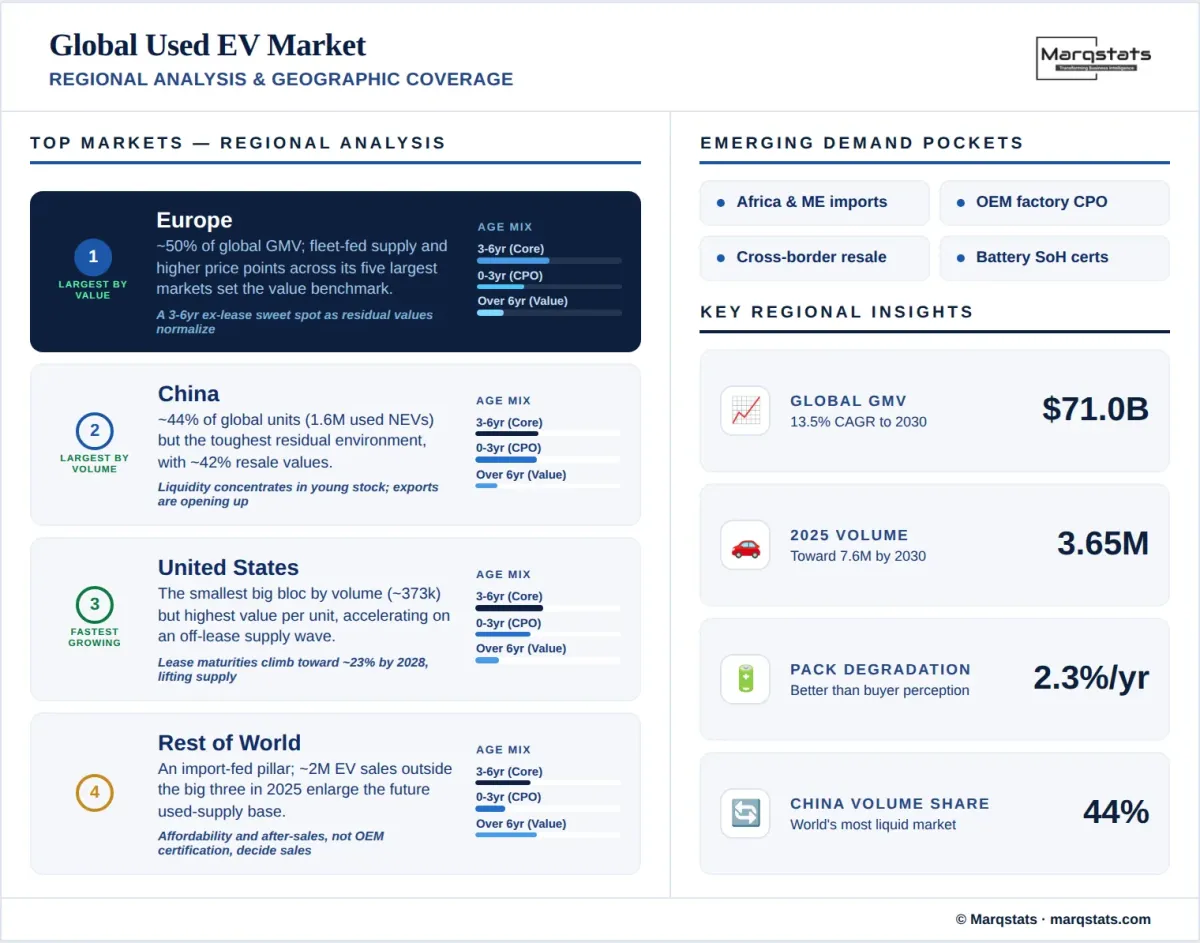
Global Used EV Market Regional Analysis Geographic Coverage Infographic
Competitive Landscape

How Competition Is Evolving

The global used EV market is fragmented, with no single company leading worldwide; instead, regional champions dominate their home markets. In the United States, national online-first and omnichannel retailers each move hundreds of thousands of vehicles annually; in Europe, pan-European wholesale marketplaces, fleet lessors, and OEM certified pre-owned programs set the pace; and in China, listed platforms and superstores compete alongside new-energy manufacturers, though the largest listed specialist holds only about 0.3% of that market. Battery makers add a further layer through battery-swap and battery-health ecosystems.

Two patterns recur across regions. First, scale without battery transparency is becoming less defensible as state-of-health certification turns battery condition into a priced attribute. Second, the most durable winners are hybrid operators that combine digital demand aggregation on the front end, inspection, reconditioning, and finance in the middle, and multi-channel disposal on the back end. This is why marketplaces, lessors, OEM-backed programs, and inspection-technology providers matter more than single-format classifieds.

Because manufacturer- and channel-specific used-EV shares are rarely disclosed, competitive position is best read through vehicle throughput, used-car market share, and electrified mix rather than published EV-only rankings. The strategic shift is unmistakable: leadership is moving from simply having EV stock to being demonstrably better at sourcing, certifying, financing, and remarketing it across borders and channels.
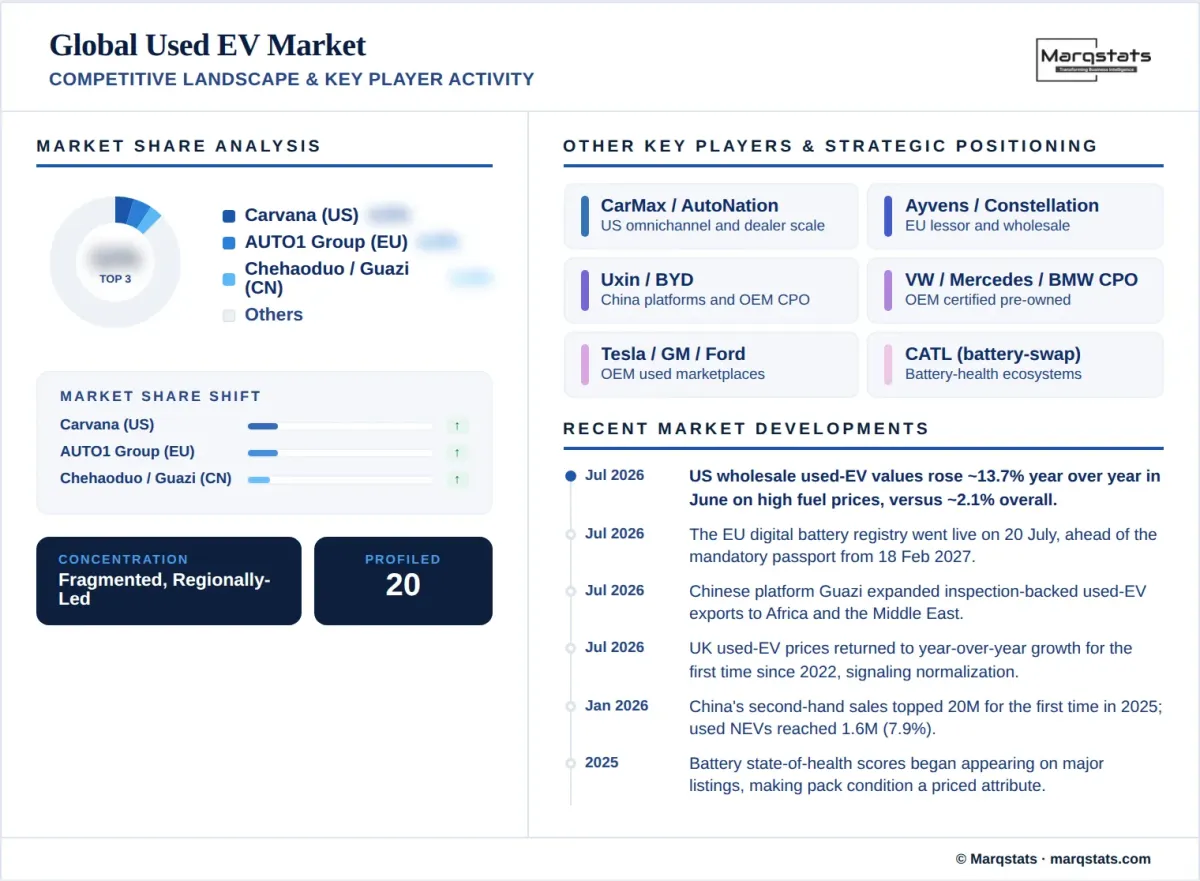
Global Used EV Market Competitive Landscape Key Player Activity Infographic
Major Players

Companies Covered

The report profiles 20++ companies with full strategy and financials analysis, including:

Carvana Co.
CarMax, Inc.
AutoNation, Inc.
Tesla, Inc.
General Motors Company
Ford Motor Company
AUTO1 Group SE
Ayvens SA
Constellation Automotive Group
Stellantis N.V.
Volkswagen AG
Mercedes-Benz Group AG
Bayerische Motoren Werke AG
Uxin Limited
Chehaoduo Group (Guazi)
BYD Company Limited
NIO Inc.
Contemporary Amperex Technology Co., Limited (CATL)
Volvo Car AB
Hyundai Motor Company
Note: Full company profiles include revenue analysis, product portfolio, SWOT, and recent strategic developments.
Latest Developments

Recent Market Activity

Jul 2026
U.S. wholesale used-EV values rose about 13.7% year over year in June as high fuel prices lifted demand, far outpacing the roughly 2.1% gain in the broader used market.
Jul 2026
The EU’s digital battery registry went live on 20 July 2026, ahead of the mandatory battery passport from 18 February 2027, strengthening global used-EV battery traceability.
Jul 2026
Chinese platform Guazi expanded inspection-backed used-EV exports to Africa and the Middle East, opening new emerging-market demand corridors.
Jul 2026
UK used-EV prices returned to year-over-year growth for the first time since 2022, signaling residual-value normalization across Europe.
Jan 2026
China’s second-hand vehicle sales topped 20 million units for the first time in 2025, with used new-energy-vehicle transactions reaching 1.6 million (7.9% of the market).
2025
Battery state-of-health scores began appearing on major used-vehicle listings, making pack condition a priced, merchandised attribute across markets.
Report Structure

Table of Contents

1. Introduction
1.1 Study Assumptions & Market Definition
1.1.1 Used EV Definition (Second-hand BEV & PHEV Passenger Vehicles)
1.1.2 Propulsion Scope — BEV & PHEV
1.1.3 Channel Scope — Dealer, CPO, Online, Wholesale & Export
1.1.4 Exclusions — New EVs, Commercial Vehicles, Two-Wheelers
1.1.5 Gross-Merchandise-Value & Unit-Volume Basis
1.2 Scope of the Study — 4 Regions
1.3 Currency, Value Basis & Base Year (2025)
1.4 Key Definitions & Terminology
1.4.1 Off-Lease, Fleet Return & Trade-In
1.4.2 Battery State-of-Health, Passport & Warranty
1.4.3 Residual Value & Total Cost of Ownership
2. Research Methodology
2.1 Analysis Framework & Multi-Region Reconciliation
2.2 Regional Transaction & Value Model
2.2.1 Official Anchors (China, U.S.) & IEA-Based Europe
2.2.2 Rest-of-World Estimate (EV Stock & New-Sales Scaling)
2.2.3 Currency Conversion & Parallel Unit/Value Outputs
2.3 Residual-Value & Pricing Model
2.4 Company-Disclosure Cross-Check
2.5 Registration & Lease-Maturity Validation
2.6 Primary Research — Global Dealer, Lessor & OEM Interviews
2.7 Assumptions, Estimate Flags & Confidence Levels
3. Executive Summary
3.1 Global Market Size & Forecast 2021–2030 (Units & Value)
3.2 Regional Divergence — Volume vs. Value Leadership
3.3 China Volume, Europe Value, U.S. Growth
3.4 Remarketing-Led Operating Model
3.5 Battery Transparency as the Global Trust Variable
4. Global Market Overview & Demand Analysis
4.1 Global Used-EV Sales & Value 2025 (3.65M / USD 71B)
4.1.1 Regional Volume Shares
4.1.2 Regional Value Shares
4.1.3 Value-vs-Unit Growth Divergence
4.2 Supply — Off-Lease, Fleet Returns & First-Owner Churn
4.3 Affordability & Total Cost of Ownership
4.4 Battery Health, Certification & Warranty
4.5 Value Chain & Ecosystem
4.6 Porter's Five Forces Analysis
5. Market Dynamics
5.1 Key Drivers
5.1.1 Worldwide Off-Lease & Fleet-Return Supply Wave
5.1.2 Affordability vs. New EVs
5.1.3 Rising Battery Transparency & EU Passport
5.1.4 Rising BEV Share of New Sales
5.1.5 Fuel-Cost Sensitivity & Professionalizing Remarketing
5.2 Key Restraints
5.2.1 Residual-Value Volatility & Depreciation
5.2.2 Battery-Health Anxiety
5.2.3 Fragmented Data & Inconsistent Standards
5.2.4 Insurance & Repair Frictions
5.3 Key Trends
5.3.1 Battery Passport & SoH Certification as Global Standard
5.3.2 Regional Divergence (Volume, Value, Growth)
5.3.3 Used-EV Exports to Emerging Markets
5.3.4 Digital & Omnichannel Retail Scale-Up
5.4 Trade, Tariff & Cross-Border Circulation
6. Battery Health, Certification & Finance
6.1 State-of-Health Diagnostics & Scoring
6.2 EU Battery Passport & Global Traceability
6.3 Warranty Structures & Battery-Swap Ecosystems
6.4 Financing, Residual-Value Risk & Insurance
7. Regulatory & Policy Framework
7.1 United States — Federal Credit Expiry & State Programs
7.2 Europe — Battery Regulation & CO2 Standards
7.3 China — Trade-In, Transfer & Zero-Mileage Rules
7.4 Rest of World — Import & Emerging-Market Policy
8. Global Market Sizing & Forecast
8.1 Global Market Size & Forecast 2021–2030
8.1.1 Unit Volume 2021–2030 (~3.65M → ~7.60M)
8.1.2 Historical Value 2021–2025 (USD 22.6B → 71.0B)
8.1.3 Forecast Value 2026–2030 (→ USD 133.90B)
8.1.4 CAGR & Absolute Growth
8.2 Regional Sizing & Share Trend 2021–2030
8.2.1 China
8.2.2 Europe
8.2.3 United States
8.2.4 Rest of World
9. Market Segmentation — By Propulsion Type
9.1 Battery Electric (BEV)
9.1.1 Volume, Value & Share 2021–2030 (Dominant)
9.2 Plug-in Hybrid (PHEV)
9.2.1 Volume, Value & Share 2021–2030 (Rising in China)
10. Market Segmentation — By Vehicle Age
10.1 0–3 Years (Near-New / CPO)
10.1.1 Volume, Value & Share 2021–2030
10.2 3–6 Years (Core Demand)
10.2.1 Volume, Value & Share 2021–2030 (Sweet Spot)
10.3 Over 6 Years (Value / Export Tier)
10.3.1 Volume, Value & Share 2021–2030
11. Market Segmentation — By Sales Channel
11.1 Franchised Dealer & OEM Certified Pre-Owned (CPO)
11.1.1 Volume, Value & Share 2021–2030
11.2 Independent Dealer
11.2.1 Volume, Value & Share 2021–2030
11.3 Online & Digital Retail
11.3.1 Volume, Value & Share 2021–2030
11.4 Wholesale & Export
11.4.1 Volume, Value & Share 2021–2030
12. Market Segmentation — By Supply Source
12.1 Off-Lease & Fleet Returns
12.1.1 Volume, Value & Share 2021–2030 (Dominant)
12.2 Private Trade-In
12.2.1 Volume, Value & Share 2021–2030
13. Regional Analysis
13.1 China — Largest by Volume
13.1.1 Market Size & Forecast 2021–2030
13.1.2 Liquidity, Residuals & Young-Stock Sweet Spot
13.1.3 Professionalization & Exports
13.2 Europe — Largest by Value
13.2.1 Market Size & Forecast 2021–2030
13.2.2 Fleet-Fed Supply & 3–6-Year Sweet Spot
13.2.3 Residual Reset & Normalization
13.3 United States — Fastest Growing
13.3.1 Market Size & Forecast 2021–2030
13.3.2 Off-Lease Wave & Affordability
13.3.3 Fuel-Price-Driven Value Recovery
13.4 Rest of World — Emerging & Import-Fed
13.4.1 Market Size & Forecast 2021–2030
13.4.2 Imports, Exports & Local Production
14. Residual-Value & Remarketing Economics
14.1 Depreciation Curves by Region
14.2 Battery Health as a Priced Attribute
14.3 Reconditioning, Certification & Financing
14.4 Channel Optimization & Disposal Strategy
15. Competitive Landscape
15.1 Market Structure & Regional Champions
15.2 North American Retailers & OEM CPO
15.3 European Marketplaces, Lessors & CPO
15.4 Chinese Platforms, OEMs & Battery Makers
15.5 Battery-Diagnostics & Inspection Technology
16. Company Profiles
16.1 Carvana Co.
16.1.1 Company Overview
16.1.2 Used-EV & Remarketing Portfolio
16.1.3 Sourcing, Volume & Channel Reach
16.1.4 Battery-Health & Certification Strategy
16.1.5 Recent Strategic Developments
16.2 CarMax, Inc.
16.2.1 Company Overview
16.2.2 Used-EV & Remarketing Portfolio
16.2.3 Sourcing, Volume & Channel Reach
16.2.4 Battery-Health & Certification Strategy
16.2.5 Recent Strategic Developments
16.3 AutoNation, Inc.
16.3.1 Company Overview
16.3.2 Used-EV & Remarketing Portfolio
16.3.3 Sourcing, Volume & Channel Reach
16.3.4 Battery-Health & Certification Strategy
16.3.5 Recent Strategic Developments
16.4 Tesla, Inc.
16.4.1 Company Overview
16.4.2 Used-EV & Remarketing Portfolio
16.4.3 Sourcing, Volume & Channel Reach
16.4.4 Battery-Health & Certification Strategy
16.4.5 Recent Strategic Developments
16.5 General Motors Company
16.5.1 Company Overview
16.5.2 Used-EV & Remarketing Portfolio
16.5.3 Sourcing, Volume & Channel Reach
16.5.4 Battery-Health & Certification Strategy
16.5.5 Recent Strategic Developments
16.6 Ford Motor Company
16.6.1 Company Overview
16.6.2 Used-EV & Remarketing Portfolio
16.6.3 Sourcing, Volume & Channel Reach
16.6.4 Battery-Health & Certification Strategy
16.6.5 Recent Strategic Developments
16.7 AUTO1 Group SE
16.7.1 Company Overview
16.7.2 Used-EV & Remarketing Portfolio
16.7.3 Sourcing, Volume & Channel Reach
16.7.4 Battery-Health & Certification Strategy
16.7.5 Recent Strategic Developments
16.8 Ayvens SA
16.8.1 Company Overview
16.8.2 Used-EV & Remarketing Portfolio
16.8.3 Sourcing, Volume & Channel Reach
16.8.4 Battery-Health & Certification Strategy
16.8.5 Recent Strategic Developments
16.9 Constellation Automotive Group
16.9.1 Company Overview
16.9.2 Used-EV & Remarketing Portfolio
16.9.3 Sourcing, Volume & Channel Reach
16.9.4 Battery-Health & Certification Strategy
16.9.5 Recent Strategic Developments
16.10 Stellantis N.V.
16.10.1 Company Overview
16.10.2 Used-EV & Remarketing Portfolio
16.10.3 Sourcing, Volume & Channel Reach
16.10.4 Battery-Health & Certification Strategy
16.10.5 Recent Strategic Developments
16.11 Volkswagen AG
16.11.1 Company Overview
16.11.2 Used-EV & Remarketing Portfolio
16.11.3 Sourcing, Volume & Channel Reach
16.11.4 Battery-Health & Certification Strategy
16.11.5 Recent Strategic Developments
16.12 Mercedes-Benz Group AG
16.12.1 Company Overview
16.12.2 Used-EV & Remarketing Portfolio
16.12.3 Sourcing, Volume & Channel Reach
16.12.4 Battery-Health & Certification Strategy
16.12.5 Recent Strategic Developments
16.13 Bayerische Motoren Werke AG
16.13.1 Company Overview
16.13.2 Used-EV & Remarketing Portfolio
16.13.3 Sourcing, Volume & Channel Reach
16.13.4 Battery-Health & Certification Strategy
16.13.5 Recent Strategic Developments
16.14 Uxin Limited
16.14.1 Company Overview
16.14.2 Used-EV & Remarketing Portfolio
16.14.3 Sourcing, Volume & Channel Reach
16.14.4 Battery-Health & Certification Strategy
16.14.5 Recent Strategic Developments
16.15 Chehaoduo Group (Guazi)
16.15.1 Company Overview
16.15.2 Used-EV & Remarketing Portfolio
16.15.3 Sourcing, Volume & Channel Reach
16.15.4 Battery-Health & Certification Strategy
16.15.5 Recent Strategic Developments
16.16 BYD Company Limited
16.16.1 Company Overview
16.16.2 Used-EV & Remarketing Portfolio
16.16.3 Sourcing, Volume & Channel Reach
16.16.4 Battery-Health & Certification Strategy
16.16.5 Recent Strategic Developments
16.17 NIO Inc.
16.17.1 Company Overview
16.17.2 Used-EV & Remarketing Portfolio
16.17.3 Sourcing, Volume & Channel Reach
16.17.4 Battery-Health & Certification Strategy
16.17.5 Recent Strategic Developments
16.18 Contemporary Amperex Technology Co., Limited (CATL)
16.18.1 Company Overview
16.18.2 Used-EV & Remarketing Portfolio
16.18.3 Sourcing, Volume & Channel Reach
16.18.4 Battery-Health & Certification Strategy
16.18.5 Recent Strategic Developments
16.19 Volvo Car AB
16.19.1 Company Overview
16.19.2 Used-EV & Remarketing Portfolio
16.19.3 Sourcing, Volume & Channel Reach
16.19.4 Battery-Health & Certification Strategy
16.19.5 Recent Strategic Developments
16.20 Hyundai Motor Company
16.20.1 Company Overview
16.20.2 Used-EV & Remarketing Portfolio
16.20.3 Sourcing, Volume & Channel Reach
16.20.4 Battery-Health & Certification Strategy
16.20.5 Recent Strategic Developments
17. Investment & Future Outlook
17.1 Off-Lease Supply & Inventory Investment
17.2 Battery-Diagnostics & Certification Technology
17.3 Digital Retail & Financing Platforms
17.4 Cross-Border Consolidation & M&A Outlook
18. Opportunities, Risks & Strategic Recommendations
18.1 Growth Opportunities by Segment & Region
18.2 Residual-Value, Policy & Battery Risk Assessment
18.3 Sourcing, Pricing & Certification Strategy
18.4 Strategic Recommendations for Dealers, Lessors, OEMs & Investors
19. Appendix
19.1 Research Methodology Detail
19.2 Unit-&-Value Model & Estimate Confidence Flags
19.3 Abbreviations & Glossary
19.4 List of Tables
19.5 List of Figures
19.6 Disclaimer & Legal Notice
Study Scope & Focus

Coverage & Segmentation

This report provides a comprehensive analysis of the global used EV market for the historical period 2021–2025, with 2025 as the base year and a 2026–2030 forecast period. A used EV is defined as a second-hand passenger vehicle powered by a battery-electric or plug-in hybrid drivetrain, and the market is quantified as gross merchandise value in US dollars, with unit volume as a validation metric. Coverage consolidates four regions—China, Europe, the United States, and the Rest of World—and spans market sizing and forecasts, segmentation by propulsion type, vehicle age, sales channel, and supply source, regional analysis, competitive structure, and the residual-value, battery-health, policy, financing, and insurance factors shaping the market.

The analysis reconciles regional differences in reporting, pricing, and data availability into a consistent global view, using official anchors from China and the United States, IEA-based Europe estimates, and a Rest-of-World estimate calibrated to electric-vehicle stock and new-sales growth. It integrates supply-side drivers—lease maturities, fleet de-fleeting, and first-owner churn—with demand-side drivers such as affordability, fuel-cost sensitivity, and battery transparency, and it provides an operating framework for sourcing, pricing, certification, channel strategy, and residual-risk management across markets.


Frequently Asked Questions

FAQs About the Global Used EV Market

The global used EV market reached about 3.65 million units and USD 71 billion in 2025, and is projected to reach roughly 7.60 million units and USD 133.90 billion by 2030.
The market is expected to grow at a 13.53% CAGR by value between 2025 and 2030; unit volume grows faster, near 16% a year, because average used-EV prices are falling in China and Europe.
China is the largest and most liquid market by volume (about 44% of units), while Europe leads by value (roughly 50% of the total) and the United States is the fastest-growing major region.
By volume, China leads with about 44% of units, ahead of Europe (~36%) and the U.S. (~10%). By value, Europe leads at roughly 50%, China ~27%, and the U.S. ~18%, reflecting large regional price differences.
Leading participants include Carvana Co., CarMax, Inc., AUTO1 Group SE, Ayvens SA, Uxin Limited, BYD Company Limited, and Tesla, Inc., alongside OEM certified pre-owned programs and fleet remarketers.
A worldwide off-lease and fleet-return supply wave, affordability versus new EVs, rising battery-electric share, and battery-health transparency—reinforced by the EU battery passport—are the main drivers.
The report is delivered as a PDF report (300+ pages), Excel data tables with market sizing across 2021–2030 by region, propulsion type, age, channel, and supply source, and an editable PPT summary. Customization is available on request.