The Mechanics of a Self-Sustaining Transition
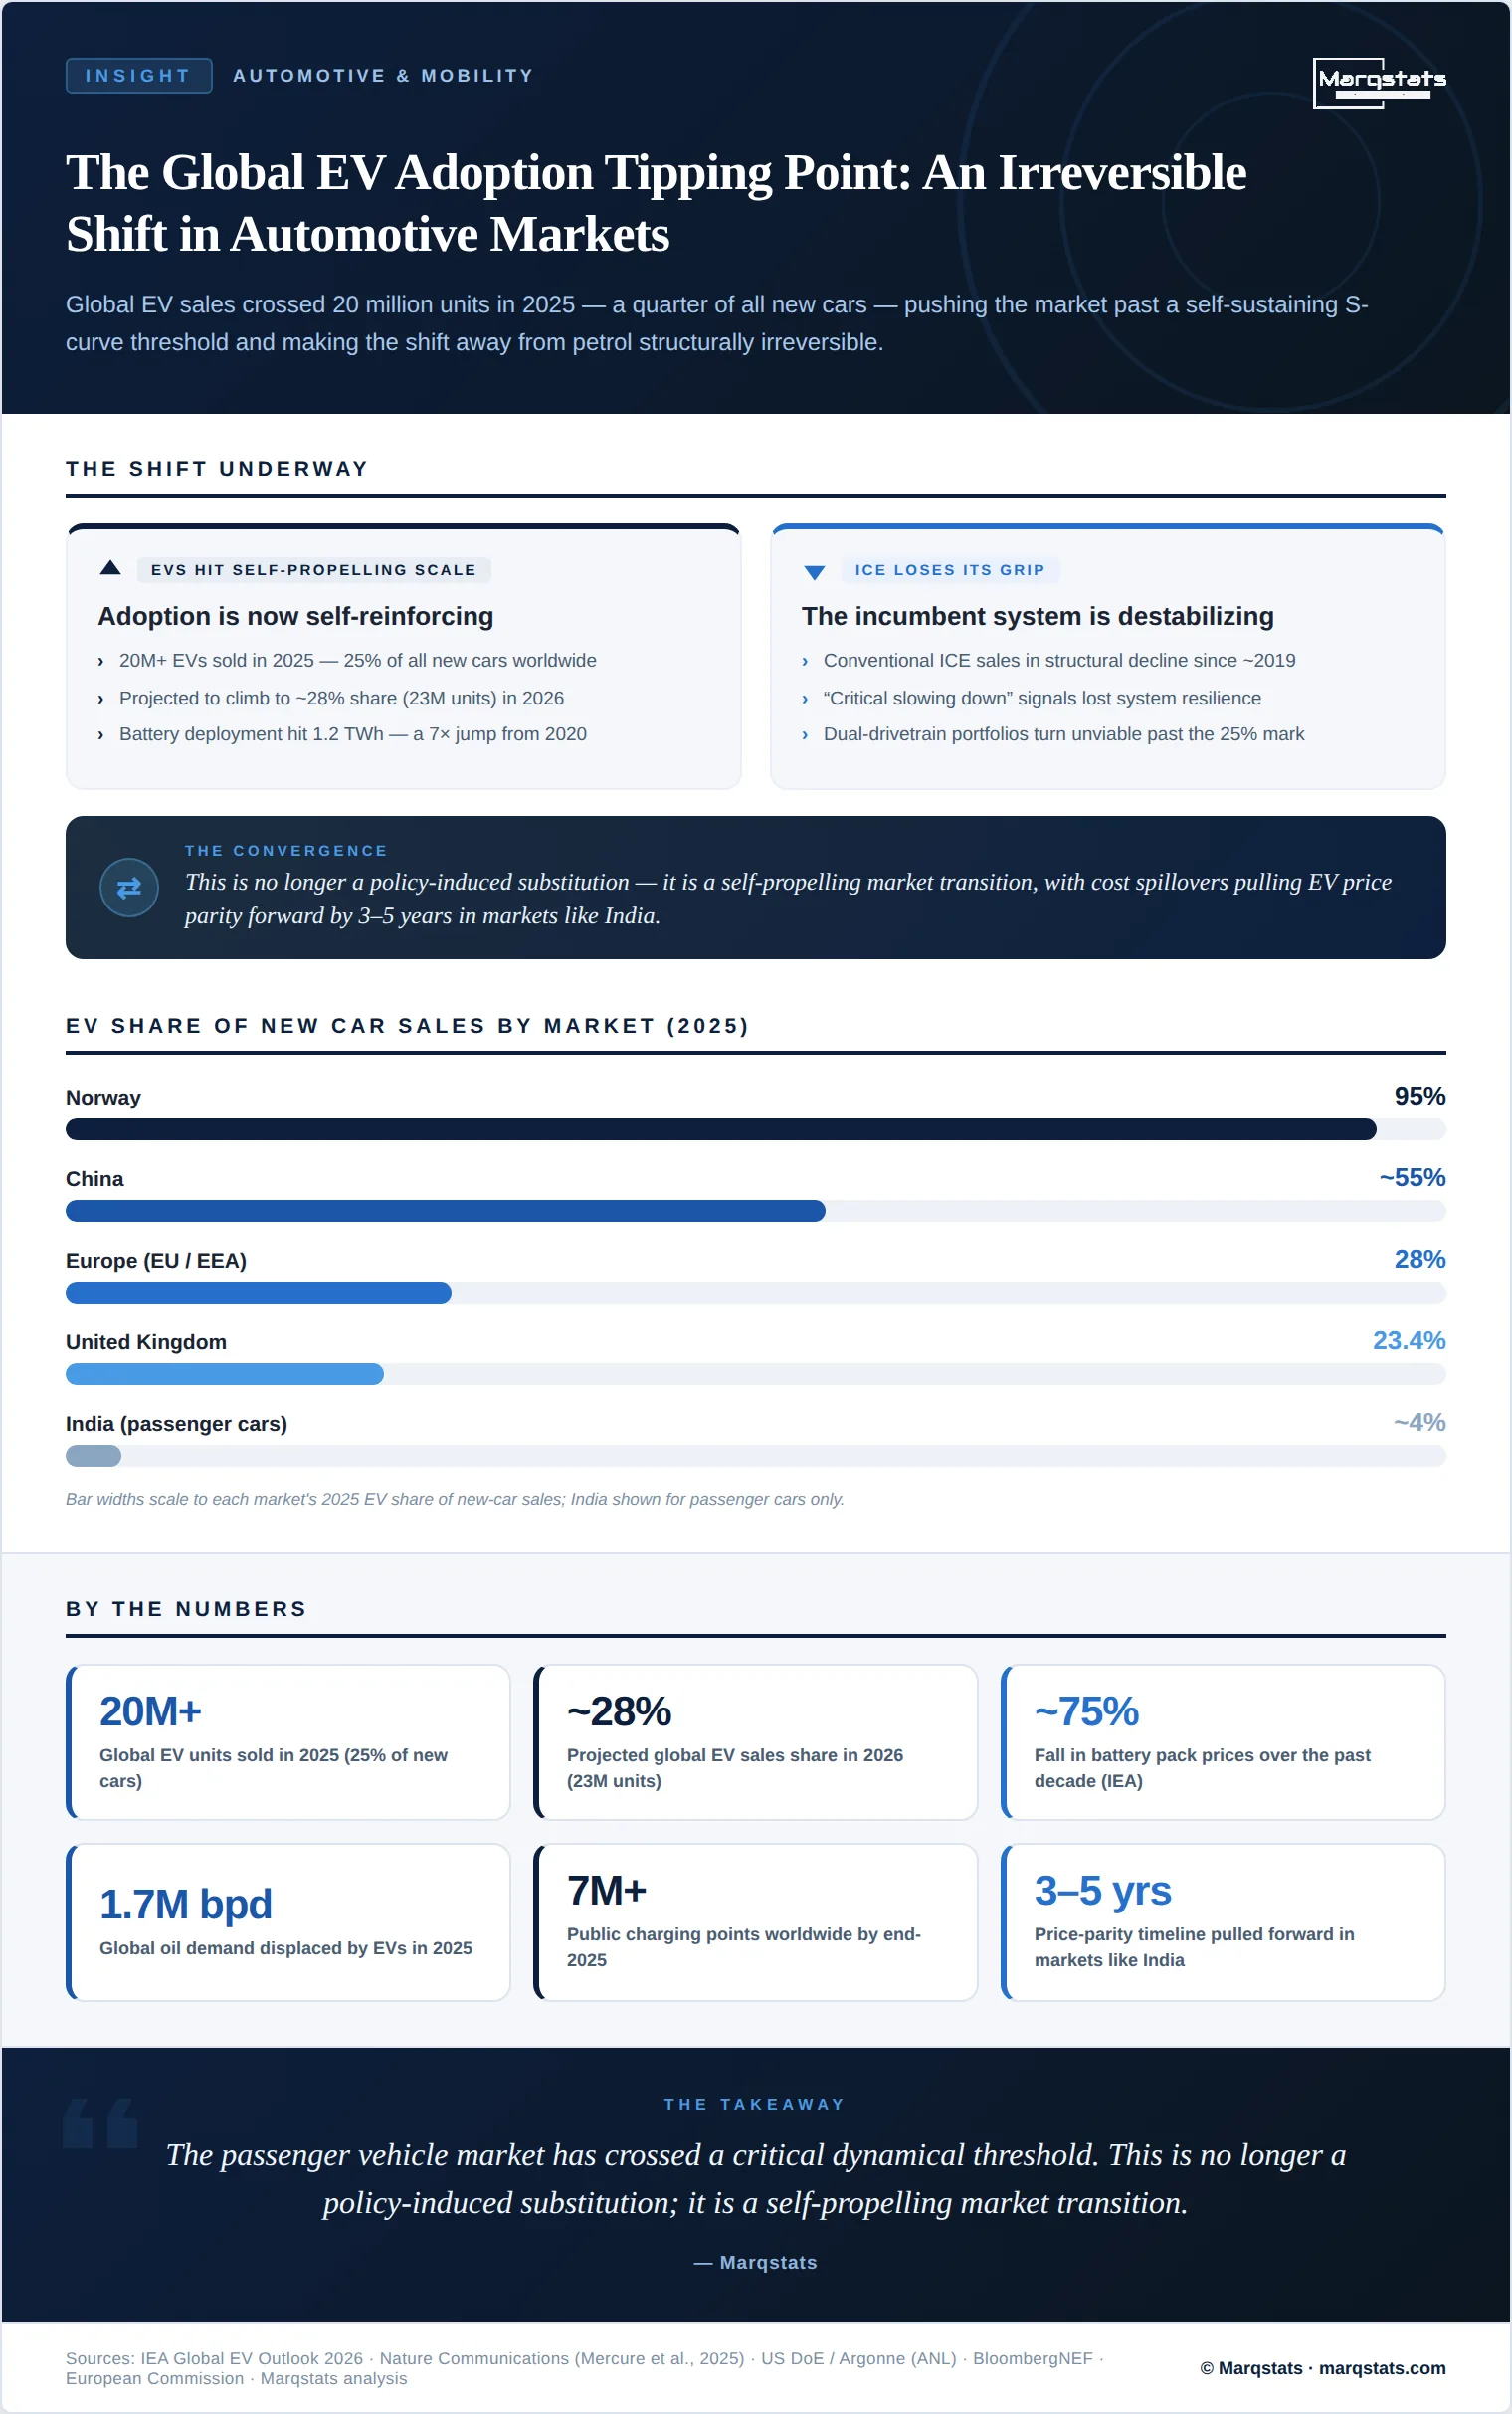
Global automotive markets crossed a historic threshold in 2025, as electric vehicle (EV) sales surpassed 20 million units for the first time and captured 25% of all new-car sales worldwide. The milestone represents far more than a strong sales year; it signals that the EV adoption tipping point has been reached and that the transition has entered a self-sustaining S-curve phase. With global sales projected to climb to 23 million units in 2026 — lifting EV market share to roughly 28% — the movement away from fossil-fuelled transport is becoming structurally irreversible.
Evaluating this shift means moving beyond linear projection to the dynamics of technological S-curves. Peer-reviewed research published in Nature Communications (Mercure et al., 2025) shows that the global passenger-vehicle market has approached or surpassed a positive tipping point where EV adoption becomes self-propelling. A sharp, sudden decline in conventional internal-combustion-engine vehicle (ICEV) sales began around 2019, concurrent with an exponential rise in EV sales.
A critical indicator is the loss of resilience in the incumbent ICEV system. Dynamical-systems theory holds that as a dominant system loses stability it exhibits critical slowing down — increased variance and lag-1 autocorrelation in sales fluctuations. This early-signal pattern has been observed empirically in lead markets, showing that petrol and diesel vehicles are losing their systemic grip and clearing the path for an irreversible technological substitution.
The Experience Curve and Battery Economics
At the core of this self-reinforcing tipping point is the interaction between market diffusion and the manufacturing experience curve. As cumulative production of lithium-ion batteries scales, manufacturing cost declines according to a predictable power law: each doubling of cumulative global production yields a consistent percentage reduction in pack-level cost. In 2025, global battery-pack deployment reached 1.2 TWh — a sevenfold increase from 2020 — providing the industrial scale needed to depress unit costs.
Battery packs, historically up to a quarter of an EV's bill of materials, have seen prices fall sharply, driven by chemistry optimization, manufacturing overcapacity, and intense supplier competition. The International Energy Agency (IEA) reports that battery prices have fallen by roughly 75% over the past decade while energy density has risen by 60%. This is bringing EVs to direct purchase-price parity with ICEVs across multiple segments — the primary financial and psychological catalyst for mass-market adoption.
Cost-curve data anchor the path to parity. U.S. Department of Energy analysis (Argonne National Laboratory) places volume-averaged pack cost near USD 140/kWh for model-year 2023, falling toward a target of about USD 86/kWh by model-year 2035 — and as low as USD 56/kWh by model-year 2029 once advanced-manufacturing production tax credits are included. Direct purchase-price parity with comparable ICEVs is associated with pack costs below USD 100/kWh, with an ultimate target near USD 80/kWh.
As the cost curve descends, alternative chemistries accelerate the transition. The rapid adoption of lithium-iron-phosphate (LFP) cells — which avoid expensive, geopolitically volatile cobalt and nickel — offers a highly cost-effective option for high-volume entry segments, narrow-margin fleets, and cold-resistant urban transport, enabling a wave of affordable compact EVs to dominate entry segments in emerging and developing markets.
Spatial Technology Diffusion and Core-to-Periphery Cascades
The spatial diffusion of EV technology follows a core-to-rim pattern. Innovation, regulatory pressure, and supply-chain scale are concentrated in lead markets — primarily China, the European Union, and the United States — which together form the core of the global automotive sector. Progress there is now generating cost-reduction spillovers that accelerate adoption across peripheral and emerging markets through two socio-technical mechanisms:
Cost-reduction spillovers: policy-driven capital investment in core markets drives down global battery and technology costs, projected to bring forward EV price parity in peripheral markets such as India by three to five years.
Used-fleet influx: because fleets in many developing countries are historically dominated by used cars exported from wealthier nations, the lead-market transition will eventually supply peripheral markets with affordable used EVs, bypassing initial local-production hurdles.
Among the lead markets, China led at roughly 55% of new-car sales in 2025 and is on track toward 60% in 2026, with monthly peaks above 60% in April 2026 supported by a CNY 20,000 national trade-in program. The European Union reached 28% in 2025 and is moving toward one in three cars sold as fleet-wide CO2 standards tighten, while Norway sits near saturation at 95%. The United Kingdom recorded 23.4% of registrations under its Zero Emission Vehicle (ZEV) Mandate, which has mobilized over GBP 41 billion in private automotive investment since 2020 and established a domestic battery supply chain worth over GBP 8.5 billion across 14 active projects; the average UK household switching to an EV saves around GBP 900 a year in fuel and maintenance.
Outside the core, Southeast Asia shows the most rapid absolute growth, with electric-car sales in emerging markets other than China surging 80% in 2025 to a record near 1.2 million units. Vietnam reached 37% of sales, rising to 39%, on the strength of VinFast's near-total domestic share, and Thailand reached 27% of new-car sales. In India, passenger-car electrification remains early at roughly 4% of sales, yet the electric three-wheeler segment has crossed an absolute tipping point, capturing nearly 70% of national sales (about 800,000 units) in 2025 and primarily displacing compressed-natural-gas options.
“We saw the two-wheeler and three-wheeler segments cross direct unit-economic parity in key emerging markets in late 2025, operating entirely free of purchase subsidies.”
— Senior analyst, South Asian OEM consortium (interviewed January 2026)
Infrastructure Densification and Regulatory Standards
Long-term sustainability hinges on the co-evolution of charging infrastructure — a powerful positive feedback loop. As the operational fleet expands, the commercial viability of charging networks improves, attracting private capital and densifying the network, which in turn minimizes range anxiety and removes the final behavioural hurdle for mainstream consumers.
Deployment crossed major milestones in 2025. Close to 1.8 million new public charging points were installed worldwide, taking the global public stock past 7 million, supported by over 43 million private home chargers serving a global fleet of approximately 76 million electric cars.
Regulatory frameworks have shifted from aspirational to structurally binding. The European Union's Alternative Fuels Infrastructure Regulation (AFIR), in force since April 2024, mandates DC fast-charging of at least 150 kW every 60 km along the core Trans-European Transport network and requires contactless card payment above 50 kW while prohibiting subscription-only access; standardized real-time data APIs (DATEX II) take effect from April 2026. This has driven Europe's public network past 1.3 million points as of April 2026. In the United States, the NEVI program funds fast-charging hubs along interstate corridors with open-payment integration and real-time reliability reporting.
Heavy-duty vehicle (HDV) charging is expanding rapidly. Europe's public HDV network recorded 937 locations in late 2025, with Sweden and Germany at the front of the rollout of high-power (350 kW and above) hubs for long-haul zero-emission logistics; Fastned holds the largest share of Europe's HDV charging pools at 14%, followed by EnBW at 12% and IONITY at 9%. In the United States, public DC fast-charging expanded to 73,394 ports across 13,708 locations as of Q1 2026, with high-power chargers (250 kW and above) reaching 55% of new non-Tesla deployments and the NACS (SAE J3400) connector accounting for 21% of new non-Tesla connectors.
Macroeconomic Implications: Oil Displacement and Grid Integration
The cascading transition from fossil-fuelled propulsion to electric drivetrains is generating profound macroeconomic and geopolitical effects. Because road transport accounts for nearly half of global oil demand, the rapid growth of the EV stock is actively reshaping the global energy balance. In 2025, the operational EV fleet avoided consumption of approximately 1.7 million barrels of oil per day — equivalent to Indonesia's total national oil demand. China, the world's largest crude importer, led this displacement, cutting domestic oil demand by 1 million barrels per day. Under current stated policies, displacement is on track to triple to roughly 5 million barrels per day globally by 2030, reshaping the revenue models of oil-exporting nations and improving the energy security of importers.
Geopolitics has reinforced the economics. High crude prices stemming from Middle East tensions have widened the operational savings of driving electric; the IEA reports that in high-oil-price conditions averaging around USD 100 per barrel, EU EV owners realized fuel-cost savings 35% higher in early 2026 than a year earlier — an immediate nudge to mainstream consumers.
On the demand side, the global EV fleet consumed about 250 TWh of electricity in 2025, roughly 1% of total global electricity demand. As the fleet expands, transport electricity demand is projected to rise sixfold to exceed 1,500 TWh by 2035 — a manageable scale equal to only about 4% of projected global consumption. To ease localized grid bottlenecks, operators and utilities are deploying smart-charging algorithms and home solar-plus-storage to shift peak loads.
Strategic Imperatives for the Global Automotive Value Chain
The structural transition has passed the point of reversal, leaving legacy manufacturers, utilities, and policymakers with distinct imperatives. Once EV sales cross 25% and head toward 50%, traditional ICEV production chains experience severe scale diseconomies, making dual-drivetrain portfolios commercially unviable. Three areas demand focus:
Powertrain consolidation: legacy OEMs must phase out conventional ICE architectures and redirect capital to dedicated, pure-play BEV platforms, since dual-platform production introduces systemic inefficiencies that vertically integrated competitors readily exploit.
Supply-chain localization and chemistry diversification: with cells the dominant cost component, manufacturers must secure localized cell production while diversifying chemistry, moving entry models to cobalt-free LFP or emerging sodium-ion to match the pricing of global export platforms.
Synergy with software-defined architecture: modern EVs run on a centralized electrical/electronic architecture optimized for software-defined features, so OEMs must unify powertrain engineering with advanced software stacks, converting vehicles into monetizable, remotely updatable platforms.
Sources
International Energy Agency (IEA) — annual Global EV market report, 2026 edition: sales, battery, charging, and oil-displacement data. iea.org
Mercure et al. (2025), Nature Communications — peer-reviewed evidence of a cascading positive tipping point toward electric vehicles. nature.com
U.S. Department of Energy / Argonne National Laboratory — cost analysis and projections for U.S.-manufactured automotive lithium-ion batteries. energy.gov
European Commission — climate and transport briefings on EV sales, fuel savings, and fleet CO2 standards. ec.europa.eu
European Alternative Fuels Observatory (EAFO) — heavy-duty vehicle recharging infrastructure progression and power-capacity data. alternative-fuels-observatory.ec.europa.eu
UK Department for Transport / ZEV Mandate reporting — registration shares, tradable-credit system, and investment outcomes. gov.uk